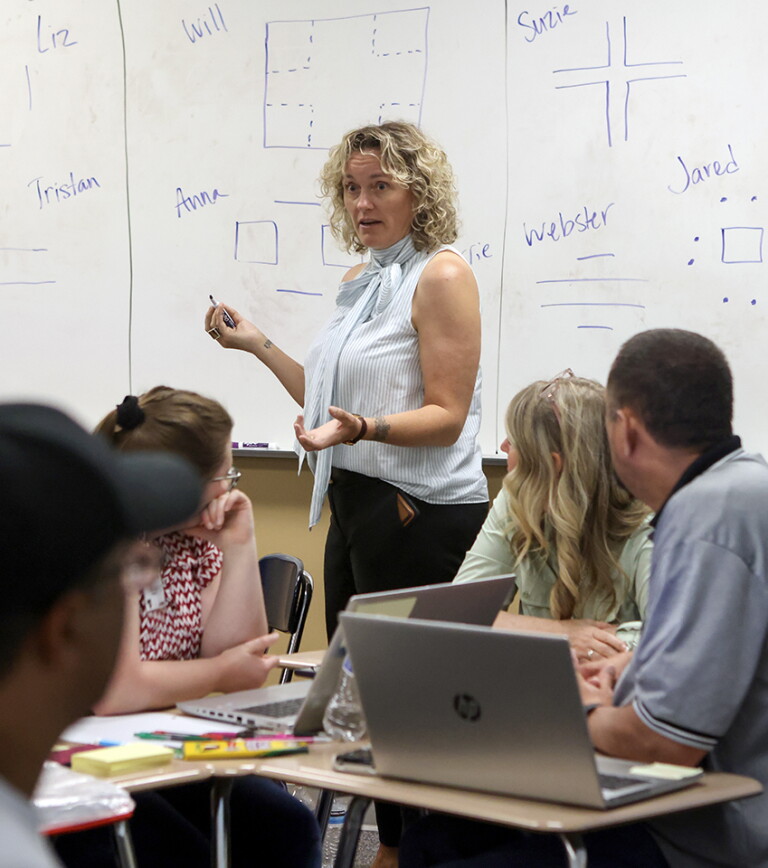

Lindsey Henderson hopes to change the conversation about math in her state.
As student math performance declined in Utah and states across the nation over the pandemic, most learning-recovery efforts have looked to shore up basic numeracy and algebra skills. But that strategy is likely to worsen declines in students’ understanding of statistics and geometry that began long before COVID-19 became a household world, experts say.
These worsening declines come just as workforce needs for data analysis and graphics skills ramp up.
In Utah, which is set to update its math standards this fall, business leaders have warned that schools don’t produce enough graduates capable of the data and statistical analyses needed for the technology and other jobs driving the state economy now.
“Data is the new literacy of 2023,” said Henderson, the secondary-math specialist for the state board of education. “It’s not that [students] just need to know how to calculate something or know the standard deviation of something off the cuff. We need a workforce able to take mathematical questions about the data and know where to go to find the solutions that help solve those questions. Those sorts of skills are the ones that our tech community wants our students to have experience with, specifically in a math classroom.”

The building blocks of data literacy may include familiar concepts like understanding basic coordinates on a graph or visually representing information. But teachers emphasize that it’s more than that; it’s also a way of thinking. Students must learn how to collect and measure data to answer a question, how to describe them, and how to make predictions based on them.
Say, for example, students are asked to help the cafeteria director figure out how much milk to buy. They’d collect that data perhaps by collecting used containers, and from there discuss: Is one class an outlier, where everyone drinks juice? Do students’ consumption patterns change?
Developing this process of thinking about data prepares students for higher math even before they learn the technical terms like median versus mode or confidence intervals, experts say.
If data science does get incorporated into its revised standards, Utah would join California, Georgia, Oregon, and other states looking to rebalance math instruction across K-12. In some cases, though, adding more time for statistics will come only at the expense of geometry, where the push for change has been less insistent.
Statistics and geometry are hardly the only topics getting squeezed in a math curriculum that teachers say is often crowded with too many subjects to teach in any given school year. But the problem is compounded for those topics because they often get bumped to the end of the year. And teachers, particularly those in lower grades, often have less training in how to approach the concepts, making it more likely that students get superficial instruction, if any.
“One of the powers of mathematics is the interrelatedness of it, but we often segment pieces of it,” said Trena Wilkerson, a professor of math education at Baylor University and a past president of the National Council of Teachers of Mathematics. “We’ll teach this particular thing, and we’ll teach this thing, and then this thing, rather than necessarily looking at the bigger picture. If we could view mathematics from its connectedness, then students as well as teachers would understand more deeply.”
Shrinking focus
In statistics and geometry, student performance has been falling in every grade level, particularly among disadvantaged students. On the National Assessment of Educational Progress, the set of tests known as “the nation’s report card,” the average 8th grader’s performance fell 16 scale points from 2011 to 2022 in probability and statistics and 9 points in geometry. That equates to a year or more of lost learning, as a 5-point drop on the NAEP scale means students on average performed about six months behind their previous cohort.
Fourth and 12th graders’ performances show similar slips. The declines in these two topic areas have significantly contributed to overall declines in math performance on the national assessment since 2013, particularly at the 4th and 8th grade levels, as well as historically low math achievement in the most recent NAEP.
In more concrete terms, the results mean that more than a third of 12th graders participating in the most recent NAEP cannot read a basic scatter plot—a chart that shows relationships among two variables, like height and weight—and 71 percent of all 8th graders cannot tell the difference among median, mean, and mode. Three out of 4 low-income 8th graders can’t gauge the probability of an outcome or use similar triangles to solve a geometry problem.
“After three decades of growth, there’s been absolute flatness and decline” in the last decade, said Zalman Usiskin, the director of the University of Chicago School Mathematics Project. “The prediction has to be that it gets worse from here.”
In large part, student performance in data science and geometry on national and international tests have fallen as schools made space in the curriculum for traditional number operations and algebra.
“I’d probably put in statistics first, algebra second, geometry third if I had to stack them in terms of life applicability,” said Sal Khan, the founder and head of the online tutoring program Khan Academy. “But in terms of what the [school system] will filter you out on, for better or worse, it has always been algebra skills, and that’s only gotten worse.”
Policymakers generally attributed the early drop in geometry and data performance on NAEP from 2013 to 2015 to a mismatch between the national test and the recently implemented Common Core State Standards, which moved much of the existing primary school geometry and statistics content to middle or high school grades.
“The shift of geometry and data-analysis content was made to allow a deeper focus on gateway topics such as fractions, place value, and decimals,” concluded Gregory Camilli, an education psychology emeritus professor at Rutgers University who has studied drops in statistics and geometry performance on the NAEP following the implementation of the Common Core State Standards. Camilli suggested the drop in 4th graders’ performance in geometry and statistics was balanced by a small increase in student achievement in number and operations, particularly in fractions, which has been a stumbling block for many students. Improving students’ skills with fractions was a key goal of the common core.
Over the ensuing decade, data analysis and spatial reasoning got squeezed further in both elementary and middle school instruction, as teachers in upper grades increasingly contended with more students who didn’t understand basic concepts in those areas.
It’s about access and equity in mathematics. You can’t wait for geometry and statistics until students get to high school, or only a select few can take it.
“Those standards really are set up to be this very far out vertical progression of learning in [statistics],” said Josh Recio, the director of the data-focused Launch Years project at the University of Texas at Austin. “And so anytime you see units that get skimmed over—whether that’s from COVID or whatever reason—that’s going to affect how prepared those students are.”
The timing of the content shift couldn’t have been worse. The era of “big data” exploded in the 2010s. As a result, statistician and data scientist are two of the 10 occupations projected to be the fastest growing through 2031 by, the Bureau of Labor Statistics. And data-science capabilities more generally have become some of the most sought-after job skills across fields, including business, science, policy, and even creative arts. Geometry-related careers, such as architecture, computer-assisted-design engineers, and fashion designers, by contrast, are growing slowly or at the average for the economy—which has made it more difficult to gain momentum to increase time for geometry.
“Geometry has not been at the center of areas that people studied, but it cuts across all mathematics in argumentation, reasoning, and sense-making that are important to many, many careers,” Wilkerson said.
While common core math pushed data-science and geometry content to higher grades, the Next Generation Science Standards, which were released around the same time, called for students to be fluent and comfortable with data and said that, by the start of middle school, students should begin applying those math concepts in science class. By 2018, when 20 states had adopted the NGSS and another 24 used them as a foundation for revising their science standards, educators and researchers warned of a growing disconnect between middle school math and science.
“If our students are being assessed on spatial reasoning or probability at 4th grade and even 8th grade in the NAEP, they’ve only had like two years barely looking at it,” said Christina Tondevold, a K-8 math teacher-trainer in Orofino, Idaho. “Their time to build their understanding hasn’t really happened, and teachers aren’t making it a priority.”
Teachers less comfortable
In part, that’s because math teachers, particularly in elementary and middle grades, say they are less comfortable with and have less training in how to approach probability and spatial concepts than they do with other kinds of math, like number sense or algebraic thinking. Of those who spent at least some time teaching K-12 math, nearly two-thirds said they had spent a semester or less of their preservice training learning probability and statistics, according to a nationally representative survey conducted this spring by the EdWeek Research Center.
“I think teachers who love math don’t tend to go into early or middle school,” said Wendy Lichtman, a math intervention specialist at MetWest High School in Oakland, Calif. “Teachers go into elementary [education] because they love teaching reading concepts.”
In Utah, Henderson said, new educators need five or more credits in calculus for a math-teaching endorsement but only two statistics credits and one geometry credit—none of which has to focus on pedagogy. “And so when we’re talking about what teachers are going to skip, it’s probably the stuff that they’re uncomfortable with, which I would suspect is statistics and geometry because they’ve had less experience with them,” she said.
In an EdWeek Research Center survey last fall, 56 percent of teachers said they never cover probability concepts, and nearly 30 percent don’t cover data representation, even in grades where the topics are part of state standards. Similarly, a quarter to 45 percent of teachers said they never cover geometry concepts such as two- or three-dimensional shapes and how they relate to each other or ways to measure capacity, area, volume, and angles.
This “big hole” in teacher training forces many teachers to rely heavily on textbooks, according to Dashiell Young-Saver, a high school statistics teacher in San Antonio. “Teachers are, for the most part, one chapter ahead of their students in the textbook and teaching them on the fly,” said Young-Saver, the founder of Skew the Script, a nonprofit that creates interdisciplinary statistics lessons.
When the topics are covered, they tend to be shunted—by both textbooks and teachers themselves—to the end of the school year. This means statistics and geometry topics come after testing season for most students, and teachers run a greater risk of running out of time to cover them if students don’t progress quickly, a common problem after the long months of pandemic school shutdowns.
“Even if you do have an ambitious teacher in 6th grade, perhaps, who does get to the geometry unit and wants to teach it, they are going to teach the 6th grade content without realizing that some of the students didn’t get the 3rd grade content or the 5th grade content,” said Julie Booth, a professor of STEM education and education psychology at Temple University and co-principal investigator of the GeometryByExample initiative at the Strategic Education Research Project. “So the students may get through that unit, but they don’t have the appropriate prior knowledge to really be able to learn it.”
Equity issues
Momentum has started to shift back toward data science at the state level. The newly revised California mathematics framework emphasizes statistics and data science, but its push to incorporate more real data and problem-oriented instruction has drawn significant criticism by those concerned it will politicize classrooms and pull attention from pure math concepts.
“It’s about access and equity in mathematics. You can’t wait for geometry and statistics until students get to high school, or only a select few can take it,” Wilkerson, the Baylor University professor, said. “You have to integrate the geometry, the statistics, etcetera, from pre-K through elementary and middle school, so that students are getting a deep understanding of what they need in order to be able to make choices about the mathematics that they take in high school and that they pursue post-high school.”
For example, under current graduation requirements, Utah students should complete high school with three years of integrated math courses, with the final course covering concepts from trigonometry, Algebra 2, precalculus, and data analysis. In practice, though, more than half of students opt out of their final course, even though in order to do so, they must submit a so-called “letter of shame” from their parents acknowledging that they will not be college-ready in the subject.
“It’s a real problem when you’re saying ‘this math is important’ and students and parents aren’t seeing it as relevant,” Henderson said. “Only 18 percent of students in Utah take calculus in high school, so for the other 82 percent of students, what is their option to take an enriching mathematics course as either a junior or a senior in high school?”
That’s why 60 high school math teachers across the state are piloting a new course pathway to prepare students for dual college and high school credit in data science and statistical reasoning. Zarek Drozda, the director of the nonprofit Data Science for Everyone, said the pilot courses take a more holistic approach to teaching data and statistics concepts, incorporating data collection, cleaning (or correcting errors in raw data sets) and analysis, technology use, and even discussions of ethics around the use of data and statistics. If the pilot proves successful, a new data-science strand could be added to Utah’s graduation options and expanded in the state’s math standards, which are up for renewal this fall.
Utah is among the states in the Launch Years Initiative, a project by the Dana Center at the University of Texas at Austin to develop broader math pathways, particularly in data science, from high school to college.
For example, Georgia rolls out new math standards this fall that integrate “data science statistics” across K-12. This summer has been a flurry of training for teachers in how to incorporate probability and data modeling concepts into different grades and classes from Algebra 2 and geometry to the sciences.
While some content standards have been moved up or down a grade, “probably about 85 percent of what’s in algebra is still material that was in the previous course,” said Kaycie Maddox, the director of 9-12 mathematics for northeast Georgia’s regional education service agency in Winterville. “So teachers are not going to Mars to get new math stuff. We’re doing what is good mathematics; we’re just looking at it from a different point of view, math modeling instead of being up there lecturing.”
Engaging discussions
Kyle Peterson, asecondary-math specialist for the 85,000-student Alpine school district, Utah’s largest, said he hopes the state’s data-science pilot can help push back against the tendency to focus on rote remedial work in response to students’ math learning gaps.
“Especially with the pandemic [disruptions], as teachers are choosing their essentials to cover, there are still times where geometry and statistics standards get less of a priority,” Peterson said. “Not just in this district, but I think around the nation, kids come in and they sit in rows and take notes, and math is a silent, spectator sport. We need to help teachers shift to focus on student thinking and then facilitate discussions around math.”

Yet leading these discussions is one of the most challenging changes for teachers, Henderson said. Math teachers may have less experience than those of science or social studies in wrangling student debates, particularly if they are grappling with real-life data and problems.
While such conversations can arise in any math class, statistics and geometry lend themselves more frequently to interdisciplinary projects and problems situated in live data. For example, California’s revisions to its math standards dragged on for four years, in part due to the heated debates over how to discuss social issues, particularly in data-driven math classes.
In Utah, Henderson said professional development will be crucial to getting teachers comfortable with both integrating more statistics content and having more in-depth, organic conversations about math.
“Not teachers talking at kids, but kids talking to each other mathematically—that was something that was really unique and scary to me as a teacher because I was like, what if they talked about the mathematics wrong?” Henderson said. “And it turns out, that’s important. Being wrong, having ideas, and having a safe space to try to make connections with your peers is superimportant in the learning of mathematics.”
In a June teacher training in Pleasant Grove, Utah, Henderson watched as teachers divided up on either side of the room based on their definition of a trapezoid—does it have at least two or exactly two parallel sides?—and debate their reasoning.
“We want our students to be good citizens in their real life. Maybe if we get practice debating about trapezoids, then when we get to the political discussions, it could be a little more civil,’ said Anand Bernard, an 8th grade math teacher at Sunset Junior High in the Davis school district, another one of the school systems participating in the Utah pilot, who led the debate exercise.
“Historically, that’s how math is developed: through talking with each other, sharing ideas, writing letters back and forth,” Bernard said. “Sometimes, we’ll be doing a task, and I see like six different methods and then two of them I’ve never even seen before. I can just kind of get blown away.”
Geometry and statistics concepts provide good foundations for exercises like that, Henderson said. “If you’re teaching algebra and geometry, algebra and statistics together, it’s like double bang for your buck. You’re teaching both standards and you’re creating those rich connections between the two strands for students so that they can see that you don’t just do algebra by itself.”
This story is part of Miscalculating Math, a deep examination of math instruction.
Overview and key data: Advocates say reforms in math teaching are pushing out statistics and geometry and driving a drop in students’ math scores. Here’s what you need to know.
Q&As: Hear three professionals talk about how they use statistics and geometry in their careers.
Handy guide: Find tips, lesson ideas, and free resources for beefing up instruction in statistics and geometry.
Quiz: Test your knowledge of math concepts, and then see how U.S. students fared.
Complete Coverage: There’s even more to explore on this topic. Check out the complete collection, Miscalculating Math.


