| Diplomas and Disabilities | ||
| Graduation Rates Vary The following shows the number and proportion of disabled students age 17 or older who earned standard high school diplomas in 1997-98, as a percentage of all such students in that age bracket and disability category. | ||
| Disability | Number | Percentage |
| Specific learning disabilities | 99,640 | 30.5 |
| Speech or language impairments | 4,099 | 35.0 |
| Mental retardation | 15,268 | 13.8 |
| Emotional disturbance | 13,861 | 22.3 |
| Multiple disabilities | 2,061 | 10.3 |
| Hearing impairments | 2,761 | 29.0 |
| Orthopedic impairments | 2,037 | 25.8 |
| Other health impairments | 5,052 | 29.6 |
| Visual impairments | 1,157 | 30.6 |
| Autism | 384 | 8.4 |
| Deaf- blindness | 132 | 39.2 |
| Traumatic brain injury | 671 | 27.7 |
| All disabilities | 147,123 | 25.5 |
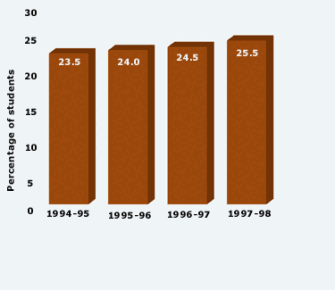
Standard Diplomas Inching Up
There has been a gradual rise in recent years in the proportion of students with disabilities earning standard high school diplomas, as a percentage of all such students ages 17 to 21 who exit their states’ education systems.

|
SOURCE: U.S. Department of Education, Office of Special Education Programs, Data Analysis System.


