
Includes updates and/or revisions.
Twelfth graders’ reading and mathematics scores on the National Assessment of Educational Progress have improved only modestly in the past four years, according to results from the latest administration, prompting renewed recognition that too few students leave high school well equipped for a promising future.
The report also marks the first time that state outcomes on NAEP were made available at the 12th grade level for those states that volunteered.
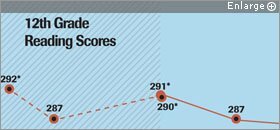
Results of NAEP, often called “the nation’s report card,” show that between 2005 and 2009, the two most recent administrations of the exam, 12th graders’ average reading score rose 2 points, from 286 to 288, on a 500-point scale.
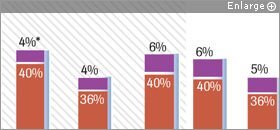
While higher than those of 2005, the latest reading scores are 4 points lower than those from 1992, the first NAEP reading assessment in the current trend line. The proportion of students performing at or above the “proficient” level rose from 35 percent in 2005 to 38 percent in 2009—considered statistically significant—although those figures are still lower than 1992 levels. One-quarter of high school seniors, however, are still reading below NAEP’s “basic” level, which means they are not considered to have mastered the skill.
12th Grade Reading and Math Scores
12th Grade Achievement-Level Results
State Performance Compared Against U.S. Average

SOURCE: National Center for Education Statistics
On the math part of the exam, average scores rose 3 points—also statistically significant—between 2005 and 2009, from 150 to 153, on a 300-point scale. A greater proportion of students
scored at or above the proficient level than did so four years earlier—26 percent compared with 23 percent in 2005. More than a third of 12th graders languish below the basic level.
The 2009 math results cannot be compared with those before 2005, because a new framework introduced that year changed the exam content enough to invalidate such comparisons. (“NAEP Governing Board Gives Nod To More Complex 12th Grade Math,” August 30, 2006)
Members of the National Assessment Governing Board, which sets policy for NAEP, saw some positive news in the 2009 results released late last month, but lamented that the numbers weren’t higher.
The reading scores “are not quite what they should be,” said West Virginia schools Superintendent Steven L. Paine, a NAGB board member. The math increases are “good but not spectacular,” said Kathi M. King, a NAGB member and math teacher from Maine. “The only good thing” about the trend, she said, “is that it’s in the right direction.”
The scores hold “worrisome” signs that students are not adequately prepared for success in college or work, said former Mississippi Gov. Ronnie Musgrove, who is chairman of a NAGB commission that is researching how NAEP might be used as a measure of college and career readiness.
Older vs. Younger
The academic portrait of the country’s high school seniors arrives as unprecedented levels of attention are being focused on improving young people’s readiness for college or careers. Precisely how NAEP achievement levels correlate with college or career readiness has not been established. A stack of special studies the board commissioned are expected to shed more light on that issue next year. (“NAEP Shows Promise as ‘Preparedness’ Yardstick,” December 1, 2010)
The scores drew a mix of reactions from education policy analysts. One point noted by some is the relative lack of progress for seniors compared with students in 4th and 8th grades. In reading, for instance, 4th and 8th graders’ NAEP scores rose 4 points between 1992 and 2005, while 12th graders’ declined by 4 points.
“Yes, there have been gains [for 12th grade], and they’re significant, but overall, the results are still disappointing, especially in comparison to the big gains at 4th and 8th grade,” said Tom Loveless, a Brookings Institution senior fellow who follows NAEP trends.
One possible explanation for 12th graders’ scores, he said, is that the exam doesn’t adequately reflect what students actually are studying in school. Another is that course content might not be as rigorous as course titles suggest. Mr. Loveless pointed out that math scores rose only 3 points, despite the fact that far more students are taking higher-level courses. Of those who took NAEP in 2009, 42 percent had taken precalculus or calculus. In 1982, only 10 percent of students had done so, according to figures from the National Center for Education Statistics.
Mr. Loveless and others also echoed a question that has long dogged the 12th grade NAEP: the possibility that 12th graders “blow off” the test. Since no consequences are attached to their performance, many have noted, they have no personal stake in doing well. Peggy G. Carr, the associate commissioner of assessment for the NCES, which oversees NAEP, said the agency is interested in working with states to embed NAEP items in higher-stakes state tests to see if that affects student motivation.
Michael W. Kirst, a Stanford University professor emeritus of education who focuses on college-readiness issues, saw the 12th grade NAEP scores as an encouraging sign that more students are building the skills necessary to succeed in postsecondary education. Mr. Kirst, who has examined the new math and reading frameworks in depth, said they are far more rigorous and demand skills much better matched to college than previous testing blueprints, so overall score gains of 2 and 3 points since 2005 are notable because they reflect progress on a tougher exam.
The new reading framework tilts more heavily toward informational texts that students would face in college or the workplace, such as textbooks and procedural manuals, and the new math framework presumes knowledge that reaches beyond the material covered in two years of algebra and one year of geometry, NAGB officials said.
First-Time State Results
States must participate in NAEP testing at the 4th and 8th grade levels in order to preserve eligibility for No Child Left Behind funding. But they are not required to do so at the 12th grade level, so state-by-state comparisons have not been possible. However, 11 states volunteered to include 12th graders in 2009.
The results show that five states—Connecticut, Iowa, Massachusetts, New Hampshire, and South Dakota—had higher average scores than did the nation in both reading and math. Idaho and Illinois outscored the country in reading but not in math, and New Jersey did so in math but not in reading. Arkansas, Florida, and West Virginia turned in lower scores in both subject areas than the national average.
Even within high-scoring states, however, the report shows significant disparities among subgroups of students. White students in Connecticut, for instance, produced an average reading score of 301, while African-American students’ average in that state was 265. Females in New Hampshire outscored males by 18 points on average, and Massachusetts students whose parents had graduated from college outscored those whose parents hadn’t finished high school by 33 points. Similar patterns were seen in the nationwide scores, as the pool of students taking NAEP grows more diverse.
Achievement gaps among subgroups didn’t shrink between 2005 to 2009 in either reading or math, even though all racial and ethnic groups and both males and females turned in higher average math scores than they did in 2005. Progress was more uneven in reading: The only subgroups that made gains in the past four years were white students, males, and Asian-Americans.
The national score report shows that students who wrote long answers to questions involving reading at least once or twice a month and those who aspire to complete college or attend graduate school were much likelier to score well. Similarly, students who took more advanced math—particularly those who reached the level of precalculus—were much more likely to do well on NAEP.
Large portions of students learning English and those with disabilities are not included in NAEP. The 2009 report shows that on average, about one-third of students with disabilities are excluded from the reading and math exams. Among English-language learners, exclusion rates averaged 21 percent on the reading exam and 14 percent on the math. In some states, exclusion rates go much higher.
New Jersey, for instance, excluded 51 percent of its English-learners from the reading test, and Florida excluded 40 percent of its students with disabilities from the math exam.


