Includes updates and/or revisions
Far more Hispanic students are taking the ACT than ever, but their scores continue to fall short of levels considered necessary for strong performance in college.
Scores released last week by ACT Inc. for the graduating class of 2010 show that the number of Hispanic students who have taken the college-entrance exam during high school grew 84 percent in the past five years. Participation by Asian-American students rose by 63 percent and by African-American students 55percent, compared with a 29 percent rise in the number of white students.
But stubborn score gaps persist among racial and ethnic groups.
Hispanic and black students were the least likely to reach ACT score levels that are predictive of college success. Only 11 percent of Hispanic students and 4 percent of black students met the ACT’s benchmarks for college readiness in all four subject areas tested, compared with 30 percent of white students and 39 percent of Asian students. The exam, which is scored on a 36-point scale, covers mathematics, English, reading, and science.
The gaps were even more stark on individual subjects. In math, for instance, 13 percent of black students and 27 percent of Hispanic students met the college-ready score of 22, compared with 52 percent of white students and 68 percent of Asian students.
Hispanic and black students were also far less likely than their white or Asian counterparts to have received the high school preparation that ACT research says equips them to thrive in college. About two-thirds of Hispanic and black students had taken four years of English and three years each of math, science, and social studies, compared with three-quarters of white students and eight in 10 Asian students.
The ethnic and racial patterns of the score report prompted renewed calls for extra attention to the needs of struggling students.
The average composite score across the four subject areas of the ACT has risen slightly since 2005. But fewer than one-quarter of the test-takers in the class of 2009 met college-readiness benchmarks on all areas of the test.
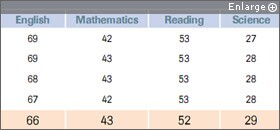
SOURCE: ACT Inc.
“Gaps exist, and it’s important that we keep them in focus and in front of us, because they need to be addressed, for the kids’ sake and our country’s sake,” said Jon L. Erickson, the senior vice president for Educational Services at the Iowa City, Iowa-based test-maker. “Progress is being made, but we need to escalate that progress.”
But the fact that more students—particularly minority students—are taking the college-entrance exam was hailed as a sign that higher education could become a possibility for more students.
“More kids in the ballgame means more access,” said Mr. Erickson.
ACT officials noted, in particular, that overall scores have not dropped even as the pool of test-takers grows larger and includes more students of varied backgrounds and skill levels. But both the average composite score and the average score in each of the four subject areas has remained essentially flat since 2006.
Math and Science Woes
The scores delivered an improving—yet still sobering—picture of college readiness.
Based on its studies of ACT-takers’ performance in college, the test-maker has set “benchmark” scores that predict early college success. Reaching those scores correlates with a 50 percent chance of getting a B or higher in entry-level core college courses and a 75 percent chance of getting a C or higher.
Of all students who took the test in the class of 2010, only 24 percent met the benchmark scores in all four subjects. That is 1 percentage point higher than in the class of 2009. Between 2006 and 2010, that level has fluctuated between 22 percent and 23 percent. (“Scores on ACT Show Majority of Students Not College-Ready,” Aug. 26, 2009.)
The math and science benchmarks are still the toughest for students to reach, a point of particular concern as the nation’seducators are placing a premium on better preparing students for careers in related fields. Only 43 percent of students tested met the math benchmark, and 29 percent met the science benchmark, compared with 52 percent who met the mark in reading and 66 percent who did so in English.
David Hawkins, the director of public policy and research for the National Association for College Admission Counseling, noted that the ACT results show modest progress toward one definition of career readiness, but that such definitions vary from one postsecondary program or institution to another. In gauging a student’s preparedness for higher education, he said, high school grades and coursework are also key indicators of his likelihood of future success.
“It’s great to look at this, but [in the admissions process] it’s important to look at where students have gone and how they’ve done,” he said.
The ACT continued its growth spurt; the pool of test-takers grew from 1.2 million in the class of 2006 to nearly 1.6 million in the class of 2010, an increase of 30 percent. In the past year alone, the number of students taking the exam grew by 6 percent. Mr. Erickson said that more than half of the ACT’s recent growth comes from states where the SAT has traditionally been the most popular college-entrance exam.
About 1.5 million students in the class of 2009 took the SAT. Figures for 2010 were not yet available. The College Board, which administers the SAT, is scheduled to release its national report Sept. 13.