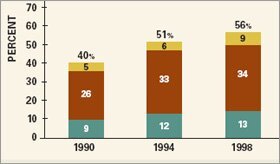
The proportion of high school students completing a challenging core curriculum rose significantly between 1990 and 2005—from 31 percent to 51 percent—and students are doing better in their classes than their predecessors did.
But that good news is tempered by other findings in two federal reports released last week. The performance of the nation’s high school seniors on the National Assessment of Educational Progress has declined in reading over the past decade and is showing no signs of improvement. Student performance is also lackluster in mathematics.
Moreover, a third of high school graduates in 2005 did not complete a standard curriculum, which includes four credits of English and three credits each of social studies, math, and science.
“America’s High School Graduates: Results From the 2005 NAEP High School Transcript Study” is posted by the National Center for Education Statistics. Also, read “NAEP: 12th-Grade Reading and Mathematics 2005.”
“Kids are doing more of what we would like them to do, on the surface,” Darvin M. Winick, the chairman of the National Assessment Governing Board, which sets policy for NAEP, said in an interview. “But my question is, are we not yet seeing the results, which means we will be soon? Or are we not doing what we need to do to raise student achievement?”
Some observers say the mixed results suggest that while access to a curriculum defined as challenging is increasing for many students, the quality of the coursework is not keeping pace.
The 12th grade reading and math results on “the nation’s report card” are based on a nationally representative sample of 21,000 seniors at 900 public and private schools who took the tests between January and March of 2005. The report on their performance was accompanied by the latest NAEP transcript study, which analyzes the coursetaking patterns and achievement of high school graduates.
Lackluster Performance
On the reading test, 12th graders’ average score has declined significantly since the first time the test was given in 1992. The test-takers averaged 286 points on a 500-point scale, a 6-point decline over 13 years, but statistically the same score as in 2002.
SOURCE: National Center for Education Statistics
Achievement levels in reading have also declined since 1992; 80 percent of the students tested that year scored at the “basic” level or better, but only 73 percent did so on the 2005 test, the same proportion as in 2002. In addition, the gap in scores between members of minority groups and higher-scoring white students has not narrowed significantly.
In math, the scores are not comparable with those from previous tests since the 2005 assessment was based on a new framework. Students scored, on average, 150 points on a 300-point scale. Just 61 percent of the seniors demonstrated at least basic command of the subject, with 23 percent considered “proficient” and 2 percent “advanced.”
Transcripts Analyzed
Two-thirds of the 26,000 graduates who were followed for the transcript study also participated in the 2005 NAEP math and science assessments. It is the fifth such study since 1990. The sample of private school students taking part in both studies was too small to allow comparisons with their peers in public schools.
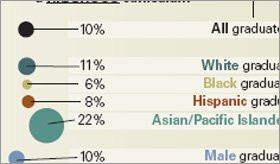
Among 2005 high school graduates, 68 percent completed at least a standard curriculum, while 41 percent took a more challenging course load that could be considered college-preparatory. Ten percent took classes deemed even more rigorous, which could include those offered through the Advanced Placement and International Baccalaureate programs.
In 1990, just 40 percent of graduates completed at least a standard curriculum, and 36 percent took additional courses, while 5 percent took what was deemed a rigorous course load.
High School graduates in 2005 completed a range of more challenging courses. Seniors, however, did not excel on the math and reading NAEP.
*Click image to see the full chart.
SOURCE: National Center for Education Statistics
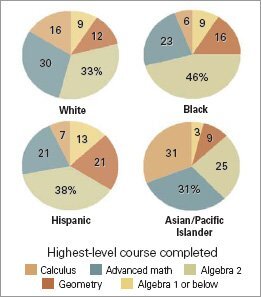
Students who took the more challenging course loads tended to score higher on the NAEP tests than those who completed a standard or less-than-standard curriculum.
Francis M. “Skip” Fennell, the president of the National Council of Teachers of Mathematics, was not surprised to see results showing that students taking more difficult courses, particularly Algebra 2, were scoring higher on NAEP.
“It sort of validates that Algebra 2 is a gatekeeper” to college and high academic achievement, Mr. Fennell said. “It confirms some of the things we’ve been saying: If we want to field a competitive workforce, students need a steady diet of math, from pre-K through grade 12.”
The transcript study also shows that students who take more demanding classes early in high school are far more likely to progress to advanced math.
For instance, 34 percent of participating students who took Algebra 1 as 9th graders went on to take advanced math or calculus. But the likelihood of taking advanced math soared, to 83 percent, among students who took geometry by 9th grade—which probably meant they took Algebra 1 as 8th graders. Mr. Fennell said he believes more schools are moving Algebra 1 to the middle grades.
The results “show that we have our work cut out for us in providing every child in this nation with a quality education,” U.S. Secretary of Education Margaret Spellings said in a statement. “If, in fact, our high school students are taking more challenging courses and earning higher grades, we should be seeing greater gains in test scores.”
The No Child Left Behind Act has raised accountability for the nation’s elementary and middle schools, and states had begun changing their education policies and practices at those levels over a decade ago. Trends on the national assessment for 4th graders have shown some improvement over that time. President Bush has proposed more-rigorous standards and accountability for secondary schools in the law’s reauthorization.
‘Big Steps Needed’
More students across minority groups are on a college-prep track than previously, and the gap between the proportion of black students participating in a challenging curriculum—which includes more math and science classes and foreign language study than the standard—and that of their white peers has disappeared. The gap between Hispanic students and non-Hispanic white students is statistically unchanged. A little more than half of white and black students completed a challenging course of study in secondary school, according to the findings, while 44 percent of Hispanic students did.
“It seems to dovetail a little with some anecdotal evidence we see around the country that there’s been progress in terms of increased recognition for the need for rigorous courses,” said Marie Groark, a senior policy officer with the Bill & Melinda Gates Foundation, which underwrites high school reform ventures in a number of states. Ms. Groark noted that the College Board reported recently that more students, and more minority students, are taking Advanced Placement courses.
Although more students are taking a more challenging course load, a far greater proportion are taking undemanding classes.
*Click image to see the full chart.
SOURCE: U.S. Department of Education, Institute of Education Sciences, National Center for Education Statistics, High School Transcript Study
“Small steps have been taken, but big steps are needed,” she said. “All students should graduate ready for college-level work and careers, but these scores indicate that’s just not the case.”
The grades students have earned generally have improved. The overall grade point average of the graduates increased over 15 years, from a 2.68 in 1990 to a 2.98 in 2005, the equivalent of about a B on a 4-point scale.
The GPAs of all subgroups of students improved over that time as well. But some minority students have not bridged the gap in grades. African-American students, for example, earned on average a 2.69 GPA, compared with the 2.82 average for Hispanic students, and 3.05 for whites. Asian-American students were highest, on average, with a 3.16 GPA.
The change could be caused by a variety of factors, according to the report, including grade inflation, differences in grading practices, and improved student performance.
The National Center for Education Statistics, the arm of the U.S. Department of Education that administers the national assessment, collected transcripts for students in schools randomly selected to take NAEP in 2005. The course titles and descriptions were analyzed to ensure consistency in how the transcripts were evaluated.
The report cautions that the transcript information does not identify reasons for the findings.
But some observers say there is wide variation in the content of courses from district to district, and even within schools. Courses labeled “advanced” are not always so, they contend.
“We’ve collected examples within the same school and the same course title of huge differences in the assignments and the expectations for students,” said Daria L. Hall, the assistant director for K-12 policy development for the Washington-based Education Trust, which promotes high academic standards for disadvantaged children. “When we see that more students are taking more advanced courses, but that their achievement is not increasing, it’s a sign that they are not getting what they need out of those courses.”


