States looking to see how they stacked up in Education Week’s Technology Counts will spot a significant change in this year’s report card on state policies and practices: Because of a shortage of available data, the report does not issue overall grades. Instead, the report gives grades in two of the three categories that have undergirded the grading structure in recent years: policies related to the use of technology for learning and policies designed to increase educators’ capacity to use technology.
Using Technology
Recent data show that most states have made progress enacting policies related to the use of educational technology. States, on average, earned a B in that category. Nine states—Arizona, Georgia, Louisiana, Maryland, North Carolina, South Carolina, South Dakota, Utah, and West Virginia—have put in place all of the policies tracked by the report in the use-of-technology category, earning each of those states a perfect score and an A. At the other end of the spectrum, with none of those policies enacted, the District of Columbia places last and receives the only F, for the second year in a row.
Since our reporting a year ago, three states—New Hampshire, Rhode Island, and South Carolina—have shown notable improvement in the use-of-technology category, while four states—Colorado, Florida, Michigan, and Tennessee—have lost ground.
Except for the District of Columbia, all states have now adopted standards detailing what students should know and be able to do with technology. About half the states (24) articulate their technology expectations solely as stand-alone documents, while 15 embed them within the standards of specific academic subjects such as science or mathematics. Eleven states do both.
The number of states testing students’ knowledge of technology has more than doubled since last year, increasing from five to 13. That increase is attributable, in part, to more active policymaking and redoubled state efforts to address the federal No Child Left Behind Act’s goal of ensuring that every student is technologically literate by the 8th grade. However, the upswing may also reflect revisions in the criteria used by Technology Counts to award credit to states for the student-testing policy.
For the 2005-06 school year, on average, 3.8 students shared each instructional computer in U.S. public schools. Beneath that national figure, computer access varied widely across the states. South Dakota provided the greatest access, with a student-to-computer ratio of 2-to-1. By contrast, the ratio was at least double that figure in 18 states and the District of Columbia. In five of those states, five or more students shared every computer.

SOURCE: Market Data Retrieval, 2005-06
States are also increasingly turning to the opportunities that online coursetaking offers their students. Twenty-nine states have established or financed at least one virtual school, up from 25 in the 2007-08 school year. All 29 of those states operate virtual schools at the high school level, with fewer providing virtual schooling for younger students. Only eight states have virtual schools serving high school, middle school, and elementary students.
Training Educators
States average a C-plus for policies that support the capacity for educators to use technology. For the second year in a row, Georgia, Kentucky, and West Virginia each earn an A for enacting at least five of the six policies monitored in this area.
At the opposite end of the spectrum, the District of Columbia, Idaho, Montana, Nevada, and Utah have adopted none of those policies and receive failing grades. New Mexico has implemented three new policies since last year, raising its capacity grade from a D to a B. Illinois and South Carolina, on the other hand, lost ground in that area.
The 2008 “America’s Digital Schools” report, conducted by the Greaves Group and the Hayes Connection, asked school districts about their adoption of various forms of technology. In the 2006-07 school year, most school districts reported having interactive whiteboards and online assessments, but only half reported having learning-management systems. Slightly more than a quarter had 1-to-1 computing in 2006-07, which means that “each student and each teacher has one Internet-connected wireless computing device for use in the classroom and at home ... [and] students are allowed to take the machines home at night.” Districts projected almost universal access to whiteboard technology and a near doubling of 1-to-1 computing by 2010.
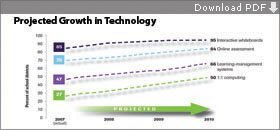
SOURCE: “America’s Digital Schools 2008,” the Greaves Group and the Hayes Connection. Copyright 2008. www.ads2008.org
The most prominent strategy for boosting capacity has been the development of standards for teachers that include technology, with 46 states having such policies. Thirty-seven states have technology standards for school administrators.
Twenty-one states have taken the step of tying initial teacher licensure to technology competence demonstrated through coursework or tests. Similar requirements for administrator licensure are in place in 10 states. However, requirements for demonstrated competence in two of those states—Kentucky and North Dakota—extend to principals only, rather than to broader categories of administrators.
Technology-competence requirements related to recertification prove to be much less common than those tied to initial licensure. Policies that link teacher recertification with technology training or test-based demonstration of technology competence now exist in 10 states, while seven have similar requirements for administrators.
Technology-Access Issues
Since 2006, Technology Counts has issued grades on the K-12 technology policies and practices in the 50 states and the District of Columbia, capturing activity in three separate categories: access, use, and capacity. This year’s report dropped its overall grades, and does not include state-by-state indicators for access to technology, because updated national and state-level data on that topic are no longer available.
These tables offer state-by-state grades by categories, breaking grades down into two categories: capacity and use.

SOURCE: EPE Research Center, 2009
The absence of ongoing state-level information on access to educational technology poses significant challenges for those concerned with tracking the spread and evolution of such resources, much less their contributions to student learning. The most recent national and state data available suggest, though, that access to such now-basic forms of technology as computers connected to the Internet has broadened significantly over the past decade.
A 2006 report by the National Center for Education Statistics found that public school classrooms connected to the Internet were a rarity in 1994. A decade later, access was virtually universal, with a relatively small gap found between high- and low-poverty schools.
The availability of instructional computers has likewise expanded over time, although recent data appear to show the nation’s public schools reaching a plateau at about four students for every instructional computer. Underlying that national trend, however, are notable state-to-state differences. According to 2006 data from Shelton, Conn.-based Market Data Retrieval, there are about two students per computer in South Dakota, but at the other end of the spectrum, there are roughly five students per computer in five other states.
Planning for the Future
Moving beyond the iconic classroom computer, the 2008 edition of “America’s Digital Schools,” a report produced by the Greaves Group and the Hayes Connection, two research consulting organizations, examined demand for a variety of technologies and applications based on a national survey of school districts in 2006-07. Most districts, for example, were employing interactive whiteboards and online assessments as part of their broader learning-technology strategies, with substantial numbers of additional school systems planning to pursue those approaches in the coming years. While only one-quarter of districts had launched a 1-to-1 student-to-computer initiative, those numbers were expected to double by 2010.
One key to understanding the importance of technology access is to track the adoption and availability of cutting-edge tools at both the national and state levels. Another important step, as many have advocated, will be moving beyond simply counting those devices to assessing their instructional utility, a consideration that often lies at the intersections of hardware, software, infrastructure, and the human factors of learning systems.
Just as a computer fresh off the shelf should offer more benefit than one that is 5 years old, even a new machine may be unable to meaningfully tap into the potential of the Internet age if it is linked to the online world through a slow, outdated connection. Low bandwidth—essentially, the rate at which data can be transported across an electronic network—can create a major bottleneck in the education-technology pipeline.
Schools are responding to that challenge. “America’s Digital Schools,” for example, reported that districts expect to increase their total bandwidth more than fivefold in the next five years. Still, some analysts believe that even those dramatic improvements would fall short of the bandwidth needs of today’s—and, more importantly, tomorrow’s—most innovative educational technologies.


