New York and Texas appear to be as different as two states can get.
New York is the neon-bright of Broadway; Texas, the bright lights of football fields. The heart of New York’s economy is Wall Street; the Texas economy revolves around petroleum and agriculture. In political shorthand, New York is blue, Texas red.
| CASE STUDIES | ||||||
|---|---|---|---|---|---|---|
|
| ||||||
| COMMENTARY | ||||||
| Table of Contents |
Yet a look at the educational policies of each state over the past decade reveals more similarities than differences—and suggests the part that accountability initiatives can play in fostering gains in academic performance.
New York and Texas designed standards-and-assessment systems that hold their poorest-performing schools accountable for improving student learning. Both used state interventions in schools that failed to meet state-mandated achievement goals. And both are seeing student achievement increase on national and state tests.
And even though New York and Texas set different goals and used different ways to measure achievement, national test data show that both states have moved from right around the national average in 4th and 8th grade math and 4th grade reading when the National Assessment of Educational Progress started collecting state-by-state data in 1992, to above that average in various categories by 2005.
Like other states, New York has sizable gaps in achievement between most minority students and their white peers, but it’s made progress in closing those gaps. On NAEP’s 4th grade reading test, the gap between Hispanic pupils and their non-Hispanic white classmates shrank by 18.3 points on a 500-point scale between 1992 and 2005, or almost two grade levels. The gap between white and black 8th graders shrank by 14.3 points in math.
Texas, meanwhile, moved from the middle of the pack nationally in 1992 before steadily increasing its NAEP rankings to at or above the national averages in many grades and subjects by 2005. In 4th grade math last year, Texas students scored just five points behind the top state—something that many observers would have thought unlikely 13 years earlier when Texas 4th graders were 14 points behind the national leader in math.
Its greatest success has been improving the achievement of its lowest-performing students in reading and math. For example, the achievement gaps between Texas students from poor families and their peers from nonpoor families shrank by 7 points on NAEP’s measures of 4th grade reading between 1998 and 2005.
‘Crude Instruments’
Regardless of the states’ different starting points, researchers, policymakers, and educators say, by and large, that neither New York nor Texas would have improved student achievement over the past decade without its accountability system.
In New York, which adopted standards defining what students should know in 1991 and assessments to measure students’ progress in learning their content in 1996, “there’s been a focus on higher achievement and an unwillingness to accept less than that,” says Thomas Sobol, a professor of education at Teachers College, Columbia University, and the state’s commissioner of education from 1987 to 1995. “There’s been a big buy-in throughout the state.”
| Vital Statistics: New York | |
|---|---|
| Public schools | 4,514 (2003-04) |
| Public school teachers | 216,116 (2003-04) |
| Pre-K-12 students | 2,864,775 (2003-04) |
| Annual pre-K-12 expenditures | $34.5 billion (2002-03) |
| Minority students | 46.1% (2003-04) |
| Children in poverty | 21% (2001) |
| Students with disabilities | 14.5% (2003-04) |
| English-language learners | 6.2% (2002-03) |
“Texas is an example showing that attention to student performance, particularly at the bottom end, can in fact lead to gains,” says Eric A. Hanushek, a fellow at the Hoover Institution, a think tank at Stanford University.
Starting in the 1993-94 school year, Texas has held individual schools accountable for student achievement in reading and math in grades 3-8. Even before that, starting with the class of 1987, Texas mandated that students pass a state high school exit exam to earn a diploma.
Most notably, each school needs to show that students in every racial, ethnic, and income category are improving. Schools that fail to meet their targets are subject to interventions from the state, which start with research analyzing a school’s problems and could result in the school’s closure if performance doesn’t improve after four years. The Texas system became the blueprint for the No Child Left Behind Act, the national school accountability program President Bush proposed during his run for the presidency in 2000 and signed into law four years ago.
By contrast, prior to the 2005-06 school year, when the federal law required all states to test annually in reading and math in grades 3-8, New York assessed students only in the 4th and 8th grades. Over the past decade, it also started phasing in its vaunted Regents exam as a diploma requirement for all students and started an accountability system that rewards schools for improving student achievement. But, unlike Texas, New York didn’t start breaking down test data by student subgroups until the No Child Left Behind law required it to, beginning in the 2002-03 school year.
Some scholars say that the different emphases of the Texas and New York accountability systems help explain the states’ gains on the congressionally mandated NAEP, which is considered the most reliable national means of providing comparable state snapshots of student performance.
| Vital Statistics: Texas | |
|---|---|
| Public schools | 7,843 (2003-04) |
| Public school teachers | 289,481 (2003-04) |
| Pre-K-12 students | 4,331,751 (2003-04) |
| Annual pre-K-12 expenditure | $30.4 billion (2002-03) |
| Minority students | 61.3% (2003-04) |
| Children in poverty | 23% (2001) |
| Students with disabilities | 11.8% (2003-04) |
| English-language learners | 15.3% (2003-04) |
“[Texas] has put a lot of emphasis on the performance of disadvantaged kids,” Hanushek says, while New York “has a lot more rewards for individual students for their performance,” particularly through the Regents exams. Previously, only students seeking an honors diploma needed to take and pass Regents exams.
Other researchers, however, question whether particular results can be traced to the specific design of each state’s accountability system.
“Accountability systems are crude instruments,” says Jay P. Greene, an associate professor of education and the chairman of the department of education reform at the University of Arkansas at Fayetteville. “They are basically whip-cracking to command school systems to work.”
States can appear to make large gains on achievement levels, Greene says, if they had a large number of students just below the threshold of an achievement level. For example, a state could have a large percentage jump in NAEP’s basic level, but not make much overall progress, if many students were close to scoring at that level in the previous testing cycle.
Texas-Style Accountability
Texas was ahead of most states when it launched its accountability system more than a decade ago. In the 1990s, the state started testing all students in reading and math in grades 3-8. By the 1993-94 school year, the state was grading each school based on the percent of students who passed the state’s tests, at the time called the Texas Assessment of Academic Skills.
On the 1992 NAEP, Texas scored near the national average on many measures. By 2005, the state’s overall 4th grade reading score was at the national average, and the state’s Hispanic students had posted substantial gains, as had its African-American students. Just 40 percent of Hispanics scored at or above basic in 1992, but 54 percent scored at those levels by last year. Over the same period, the 4th grade reading score for African-Americans went from 39 percent at or above basic to 49 percent. In 2005, Hispanic 4th graders in Texas scored near the top of the nation in math.
The only subgroup of 4th graders in the chart below that did not make significant gains on the National Assessment of Educational Progress reading exam was non-poor students in Texas. In New York, Hispanic and poor students made particularly large strides of 24 and 14 points, respectively.
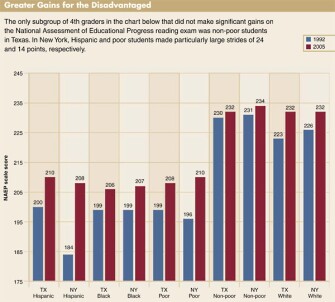
Note: Data from 1992 are not disaggregated for poor or non-poor students; results from 1998 are presented instead. Accommodations were not permitted for students with disabilities and English-language learners in 1992.
SOURCE: Editorial Projects in Education Research Center, 2006
“Whatever they’ve done has propelled the Hispanic kids [in Texas] above Hispanic kids just about anywhere else in the country,” says Chester E. Finn Jr., the president of the Thomas B. Fordham Foundation, a Washington think tank that supports school accountability measures and market-based approaches to improving schools. “That’s a very powerful accomplishment.”
“I don’t think there’s any doubt that disaggregating [test scores for minority and other students] affected adult behavior toward children who were struggling in the system,” says Mike Moses, the state’s commissioner of education from 1995 to 1999 and the superintendent of the Dallas school district from 2001 to 2004. “It drew attention where we needed to pay attention.”
In 1999, Texas also launched a two-year, $200 million campaign to help more children pass state exams, especially in reading. Some 14,000 of the state’s roughly 17,000 kindergarten teachers underwent training to improve how they taught their pupils to read, the start of a project that has since moved on to teachers in the higher primary grades.
Texas is catching up with the nation in the percentage of students who score at least at the proficient level on the NAEP reading exams. Last year, 29 percent of 4th graders scored at that level, about the same as nationally, and 26 percent of 8th graders ranked at proficient or above, compared with 29 percent for the nation.
In math, Texas tracked the national average closely when the state-by-state NAEP began in 1992. By 2005, its students scored just above the national averages in grades 4 and 8. While only 56 percent of Texas 4th graders scored at basic or above in 1992, by 2005 that figure had risen to 87 percent.
Texas succeeded in raising achievement because it set reasonable expectations on its state tests—ambitious but not unattainable, Moses says.
“You can set a bar at the point where teachers consider it irrelevant or demoralizing,” he says.
In the first year, Texas set a goal that 30 percent of students would pass the state’s exams in reading and mathematics. The state gradually increased that percentage over time.
The process “built a sense of confidence in people that they could do this,” says Kati Haycock, the director of the Education Trust, a Washington-based research and advocacy group that supports accountability measures to highlight the needs of disadvantaged students.
But some experts say there are other ways to explain the state’s NAEP gains.
In 1992, students in Texas and New York were not performing at significantly different levels from the national average on the National Assessment of Educational Progress 8th grade math exam. But by 2005, both states were performing significantly above the national average.

*Click image to enlarge
Note: Accommodations were not permitted for students with disabilities and English-language learners in 1992.
SOURCE: Editorial Projects in Education Research Center, 2006
The state had unusually high student-retention rates in the early grades even before it instituted a requirement in 1999 that 3rd graders pass the state reading and math tests to be promoted to 4th grade, says Walter Haney, a professor of educational evaluation at Boston College in Chestnut Hill, Mass., and a prominent critic of the state’s accountability policies. Forty-five percent of Texas 4th graders who participated in NAEP in 2003 were older than 9, the typical age for the grade. In Houston, the only Texas city to publish NAEP results in 2003, 54 percent of 4th graders were over that age. By comparison, the figures for overage 4th graders were 38 percent for the nation, 20 percent in New York state, and 21 percent in New York City.
That extra year of instruction can have a significant impact on a student’s achievement, especially in the earlier grades, Haney says.
But holding students back in the early grades also leads to problems by high school, he adds. The prime factor in whether students drop out, he says, is retention before secondary school. “The evidence suggests that education opportunities have been largely undermined for students” because of Texas’ high retention rates, Haney says.
It’s also part of the reason, he says, that Texas hasn’t shown the same kinds of gains in 8th grade, where an extra year of school doesn’t have the same impact on test scores.
Other research, however, points to data suggesting that students in the state are graduating at greater rates than they were in the 1990s. In 1992-93, before the accountability system began, 56.7 percent of Texas students graduated within fouryears of entering high school, according to an Editorial Projects in Education Research Center analysis. By 2001-02, that figure had risen to 67 percent.
“The more accountability we’ve had, the more our high school graduation rate has improved,” says Sandy Kress, an adviser to Texas’ then-Gov. George W. Bush in the 1990s as well as during Bush’s first term as president. “I think the story is that they enter high school better prepared to do high school work—ergo, they graduate with a little better success.”
The New York Way
Since 1992, New York has improved achievement in reading and math, including generally strong improvement by African-American and Hispanic students. In 2005, New York 4th graders scored 223 on the NAEP reading test, 6 points higher than the national average. Even more impressive, its Hispanic students gained 24.2 points on a 500-point scale between 1992 and 2005, or about two grade levels.
Its 8th graders also scored significantly higher than the nation overall, although those scores showed little change from 1998 to 2005. Last year, 33 percent of New York’s 8th graders scored at least at the proficient mark on the NAEP reading test, compared with 29 percent nationally.
New York, like Texas, set up an accountability system with various achievement levels and intervened in schools failing to meet specific achievement targets. The schools with the lowest scores are put on the “schools under registration review” list—or SURR—and were subjected to significant oversight and assistance by the state.
New York also gradually increased its expectations for its schools.
In 1989, the first year the state identified SURR sites, 267 schools were targeted for intervention. The interventions are intended to raise student achievement. The targeted schools are subject to closing by the state if their performance doesn’t improve enough.
The number of schools on the list fell gradually, to 52 during the 2004-05 school year, even though New York has made it more difficult to avoid the label in recent years.
“It’s obvious that [SURR schools] have attacked the problem of very low performance,” says Richard P. Mills, the state commissioner of education. “We’ve seen a steady downward trend” in the number of schools needing intervention.
State officials point to the narrowing achievement gaps between black and Hispanic students and their white peers as a sign that schools are meeting the needs of students who generally rank at the lower end of the achievement scale. In 1999, the state put a new accountability system in place that also rewarded schools for improving achievement among students in the middle ranges of performance.
To stay off the state-intervention list, schools must concentrate on students at the two lowest ranks on a scale of 1 to 5, with 5 being the highest.
“Schools have tried to push kids over the tipping point to level 3 from level 2,” Mills says.
School leaders add that because the state requires students to pass the state Regents exam in five subjects, schools have an incentive to intervene in the early grades. Students have to be scoring at levels 3 and 4 to ensure they’re on track to pass the exams, according to Bill Johnson, the superintendent of the Rockville Centre school district.
“There’s a tremendous amount of pressure on us to have everyone graduate with a Regents diploma,” says Johnson, whose 3,700-student district is on Long Island, about 25 miles from Manhattan.
That is perhaps why New York’s NAEP performance shows gains among a variety of student groups.
But not all of the data tell a good story.
The state’s graduation rate fell from 64.2 percent in 1992-93 to 60.9 percent in 2001-02, according to an EPE Research Center analysis. That year, only one-third of black students and 30.9 percent of Hispanic students graduated four years after starting high school.
Working for the future, Mills launched a statewide effort late last year to close achievement gaps, enlisting higher education, public libraries, and business leaders in the effort.