
Fueling the debate over high school graduation statistics, a University of Minnesota researcher is proposing a new way to gauge how states measure up when it comes to graduating students on time.
But his method points to the same disappointing conclusion as other techniques to gauge school completion rates that have sprung up in recent years: In states across the nation, high school graduation rates are slowly but steadily falling.
John Robert Warren, an associate professor of sociology at the university’s Twin Cities campus, calculates that school completion rates declined between 1975 and 2002, both nationally and in 41 of the 50 states. By 2002, the study estimates, about 72 percent of students who were on track to finish high school actually graduated on time, compared with more than 76 percent in 1975.
“State-level High School Completion Rates: Concepts, Measures, and Trends” is posted by the Education Policy Analysis Archives.
Researchers generally acknowledge that no perfect method exists now for determining completion rates at the state level. But Mr. Warren said his study, published Dec. 23 in the electronic journal Education Policy Analysis Archives,improves upon other formulas in two important ways.
First, it takes into account students who move into and out of states. Second, it adjusts for the enrollment bulge that occurs in 9th grade, a point at which higher-than-average numbers of students repeat a grade.
“Warren has the best look thus far of the different measures,” Sherman Dorn, the journal’s editor, said in an e-mail message last week. “His idea is a definite if marginal improvement.”
Mr. Warren and his critics both said the formula’s usefulness is limited because districts and schools cannot use it to calculate their own graduation rates, which they are required to do under the federal No Child Left Behind Act.
“If you ever want to study the impact of a policy, you need reliable measurements,” he said.
Push for Accuracy
States’ own estimates of their dropout and graduation rates are notoriously unreliable.
As a result, federal data on dropout rates, up until recently, have painted a rosier picture of states’ success in moving students through the school pipeline. According to Mr. Warren, federal reports over the past 50 years suggest that graduation rates steadily improved and then hit a plateau over the past decade.
To correct the problem of inaccurate data, the U.S. Department of Education and most of the nation’s governors have pledged to move to agreed-upon formulas that will yield more reliable estimates of graduation rates. (“Efforts Seek Better Data on Graduates,” July 27, 2005.)
While newer methods for calculating graduation rates differ, the simplest technique is to divide the number of graduating 12th graders by the number of 9th graders enrolled in school three years earlier.
Building on that foundation, Mr. Warren makes additional statistical adjustments for the numbers of students migrating to and from states. He does that by comparing the number of 13-year-olds, for example, in the state’s general population with the number of 14-year-olds a year later, and so on, for other age groups.
He bases his estimate of 9th grade enrollments on the numbers of students enrolled the previous year in 8th grade, where very little grade retention tends to occur.
Called the “estimated completion rate,” Mr. Warren’s calculation yields a 2002 graduation rate for the United States as a whole that is 4.2 percentage points lower than the simplest technique, a method that yields what is known as a “basic completion rate.” At the state level, more dramatic differences emerge between his method of calculation and other ones.
But calculating accurate state-level graduation rates is important, Mr. Warren argued, because that’s where most education policy changes occur.
Researcher John Robert Warren found estimated high school completion rates varied according to the methodology used.
High School Graduation Rates in Nevada and New York
*Click image to enlarge
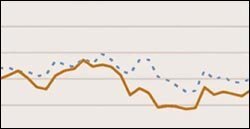
SOURCE: Education Policy Analysis Archives
For instance, in Nevada, where more students have moved into the state than have moved out in recent years, Mr. Warren’s technique yields estimated graduation rates for 1975 to 2002 that are 5 to 10 percentage points lower than those produced by simply dividing the number of seniors by the number of freshmen enrolled three years earlier.
On the other hand, the estimated completion rates were higher for New York, a state that has seen a net out-migration of students over the same period.
By Mr. Warren’s measure, five states had 2002 graduation rates below 60 percent. From lowest to highest, they are South Carolina, Alabama, Georgia, Mississippi, and Tennessee.
The states with the best records for that year, from highest to lowest, were: Wisconsin, New Jersey, Iowa, Minnesota, and North Dakota. All five had estimated completion rates above 83 percent.
Mr. Warren found graduation-rate declines of less than 10 percentage points from 1975 to 2002 for most states. In New York and Delaware, however, the drops exceeded 15 percentage points.
The trend toward falling graduation rates “confirms what other recent studies have shown,” according to Walter M. Haney, a Boston College education professor who has also studied dropout and graduation rates.
“What’s more important now may be to stop debating the relative merits of different methods,” he said, “and address the substantive issue of how we can address this decline.”


