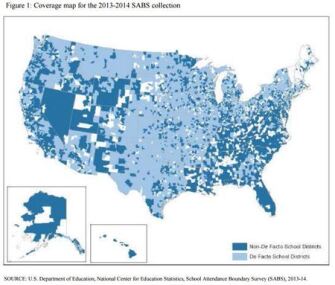
As classes start back up again, researchers and education watchers can finally dig into how students’ communities shape where they go to school. The National Center for Education Statistics has just released its massive dataset on the attendance boundaries of 85 percent of the nation’s schools.
As I wrote back in July, more than four out of five public school students attend the schools they were assigned by neighborhood, meaning school choice is still overwhelmingly a matter of relocating. Since attendance boundaries can change as often as every few years in most districts, these new 2013-14 boundaries may already be out of date in some districts, but they still give a fascinating view of how catchment areas and high school feeder patterns around the country shape up.
The new data include schools that are open and enrolling students, have at least one grade above pre-K, and are defined as a “regular school” by the federal Common Core of Data. Some magnet and charter schools were included if they used a traditional geography-based attendance zone, but most charters and magnets were left out for enrolling based on other factors, such as academic achievement.
Among the interesting tidbits bubbling up so far:
- Nearly 7,900 districts had only one school serving each grade level, called “de facto” districts.
- Four states and districts had all of their districts respond: Delaware, Hawaii, Oregon, Vermont, and the District of Columbia .
- Alabama had the lowest response rate, with only 59.6 percent of districts mapped.

Chart: The National Center for Education Statistics has mapped attendance boundaries for most schools in the United States. A “de facto” district has only one school serving each grade, while a “non-de facto” school has more than one option. Source: NCES
The full online tool will be available for districts in November.
Related:
- New Tool Maps School Attendance Zones Across US
- Socioeconomic Integration: It’s Legal, and It Makes Sense
- “Analysis Links Zoning Policies and Disparities”
