
For children from racial minorities or impoverished backgrounds, schools may actually compound the disadvantages they may face in learning fundamental math skills.
Two separate new studies—one on the National Assessment of Educational Progress in 8th grade math, the other on 15-year-olds’ math performance on the Program for International Student Assessment—both find that achievement gaps within schools account for more of the overall achievement disparities among students of different races or economic backgrounds than do gaps between schools.
On NAEP, within-school differences in achievement accounted for 16 score points of the 31-point gap in math scores between nearly 100,000 white and black 8th graders in 2011. By contrast, the study attributed only 5 points of the gap to disparities from school to school, and 10 points to other factors.
In the 33-country PISA study, disparities within schools also accounted for a larger portion of the math performance gap between wealthy and impoverished students in English-speaking countries, and in the United States, the within-school disparities were worse than the OECD average.
The studies also point to how segregation and unequal access to rigorous courses limit students’ opportunities to learn.
Sonja Santelises, the vice president for K-12 policy and practice at the Education Trust, said the studies raise questions about “everyday decisions educators are making about what access we give to young people for educational opportunities and challenging courses. Are we providing different learning experiences for some students not in the name of differentiation, but in the name of lower expectations?”
Concentrated Segregation
Racial isolation in schools significantly widens gaps in students’ math skills. In a study conducted for the National Center for Education Statistics, released last month, researchers for the American Institutes for Research found that the average black 8th grader attended a school that was more than half black, while white peers on average attended schools where only 10 percent of the population was black.
SOURCES: American Institutes for Research; U.S. Department of Education; National Assessment of Educational Progress (NAEP) 2011 Mathematics Grade 8 Assessment
The black-white achievement gap on NAEP math in 2011 steadily widened in schools as the concentration of black students within them increased. For example, researchers found that two black boys, each of whom has parents with similar education levels and incomes and attends schools with similar resources, teacher credentials, and instructional practices, show significantly different math performance on the NAEP if one attends a racially isolated school—one where 60 percent or more of students are also black—and the other attends a school in which 20 percent or fewer students are black.
“We used everything we could think of to rule out the importance of black student density itself, and we could not find anything to rule out that effect for black males,” said George Bohrnstedt, an AIR fellow who co-authored the NAEP study with Sami Kitmitto, an AIR principal researcher, on behalf of the National Center for Education Statistics, which administers NAEP.
“We don’t know if [the widening gap in high-minority schools] is because teachers have lower expectations for black students or, ... it’s possible, for black male students, they don’t want to identify with anything that’s ‘white,’ including white achievements,” he said. “Those are the kinds of things we’d speculate about.”
For his study, Michigan State University education professor William Schmidt did more than speculate about the causes of within-school disparities. Using data from 33 countries whose 15-year-old students participated in the Program for International Student Assessment, or PISA, in math, Schmidt and researchers from the Organization for Economic Cooperation and Development specifically identified unequal access to rigorous math content as a driving force behind similar performance gaps between poor and wealthy teenagers on the math PISA.
Lost Opportunities
In a study featured last week in the journal Educational Researcher, Schmidt and his colleagues found that across all countries, differences in a student’s “opportunity to learn” rigorous math content was directly related to family income, and those gaps accounted for on average a third of the overall PISA math gaps between students in the top 20 and bottom 20 percent of income levels. In the United States, differences in a student’s opportunity to learn accounted for nearly 40 percent of the math gap between wealthy and poor students.
“That magnitude is really striking,” Schmidt said. “Schools are built on the notion of everyone being able to work their way up; the ‘American Dream.’ What this says is in effect schools are working against that; it’s adding to the social-class gap.”
The PISA study built on Schmidt’s prior research, which found significant differences in the content available to students of different income levels. In one large urban school district, for example, he found students in the top 20 percent of income had five weeks more of algebra and geometry in 8th grade, while students in the bottom 20 percent of income had five weeks more of basic arithmetic.
Schmidt and his colleagues found significant differences in how much countries provided equal math opportunities to all their students within schools.
“It’s really a tragic flaw,” Schmidt said. “This is not just a problem in the United States, but a worldwide problem in these 33 major economies in the OECD. As you improve your curriculum, if you are not also dealing with these inequalities in terms of who gets what, you are actually making things worse. That’s a real eye-opening sort of thought.”
Who Has the Advantage?
At first glance, high-minority schools in the NAEP study seemed to disadvantage white, not black, students more on NAEP. The black-white achievement gap stayed flat at 25 to 26 score points, on a 500-point scale, in all schools, but white students performed significantly lower in math at schools with 40 percent or more black students.
The appearance of lower scores—often responsible for “white flight” from schools with changing student demographics—reverses on closer inspection.
The AIR researchers controlled for other characteristics known to affect student achievement, including student poverty, parent education, teacher qualifications and practices, and school resources and climate. After controlling for those factors, the AIR researchers found that white students’ math performance was actually slightly higher on average in schools with 40 percent or more black students than in overwhelmingly white schools.
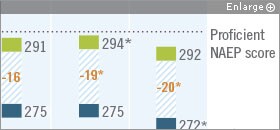
At the same time, the black-white achievement gap for boys widened steadily as the number of black students in the school increased. The achievement gap between white and black girls remained mostly flat, but black boys scored on average 25 points lower in NAEP math than their white classmates when they attended a racially isolated school. By contrast, black boys who attended a low-minority school scored on average 17 points lower than their white classmates, and, at 275 versus 270 points, significantly higher than black boys at a majority-black school.
To meet “basic” performance on NAEP’s 8th grade math, a student must score at least 262 out of 500; and the cut score for “proficient” is 299.
“The policy implications are if you are trying to reduce the [black-white achievement] gap, something needs to be done about what’s happening within schools—making sure the students who have been having the biggest problems in performance have the best teachers, or that extra professional development is available to those teachers who are working with the kids who are struggling the most—as opposed to simply moving resources between schools,” Bohrnstedt said.
The NAEP study only looked at performance on the 2011 math test for 8th grade, so Bohrnstedt said it’s not clear whether racial isolation affects students differently at different ages, or whether the effects might be compounded over time as a black or white student continues to attend a school that is ovewhelmingly populated with others of his own race.
“Are those black students in those schools being segregated into classrooms there?” Bohrnstedt said. “Schools often say they’re not tracking, but when you look inside the classrooms, you say, well, I don’t know what I would call this if not tracking.”
One more wrinkle from recent research: The University of Chicago Consortium on Chicago School Research found that a Chicago student with the same ethnic background, family-income level, and gender is less likely to be suspended in a school with low concentrations of extreme poverty than in a school with higher concentrations. If high concentrations of poverty exacerbate discipline disparities for already-disadvantaged students, this too could widen achievement gaps in those schools
“There are schools where African-Americans are achieving at high levels,” said Santelises of the Education Trust, who works with schools and districts trying to close achievement gaps.
“One of the things we know about high-achieving schools is they have an equalizing culture,” Santelises said. “All kids have access to the same content, more language [arts], challenging math. What you see is less difference in the kind of expectations, learning experiences, and opportunities for the students throughout the school.”


