For the first time, the College Board has combined its release of Advanced Placement, SAT, and Preliminary SAT/National Merit Scholarship Qualifying Test scores in a report that generally reflects expanded participation but stagnant performance.
“By looking at the programs together, you gain new insight. You see missed opportunities,” said College Board President and Chief Executive Officer David Coleman in a press briefing held last week, before the report’s Tuesday release.
In the “missed opportunities” category, the combined data revealed that 5 percent of students who were on target to meet the SAT’s college-ready benchmarks as juniors—about 29,000 of the 609,000 who took the PSAT—fell off target by their senior year when they took the SAT. The report also found that as many as 40 percent of students whose PSAT scores suggest they can succeed in AP courses never enroll in one by their senior year.
“With earlier intervention and additional supports, these kids could have been ready to succeed,” said Cyndie Schmeiser, the College Board’s chief of assessment.
Among some of the report’s more-typical findings:
• Overall, SAT participation was up less than 1 percent from 1.66 million students last year to 1.67 million in the class of 2014.
• The average score on the college-entrance exam was 1497, compared with 1498 last year.
• The share of students who met the SAT’s college- and career-readiness benchmark in the Class of 2014 was 42.6 percent, a slight decrease from 42.7 percent in 2013. (The College Board set the individual benchmark for critical reading, math, and writing combined at 1550 on a scale of 2400.)
‘Critically Low’
Performance is at a “critically low level,” said Ms. Schmeiser. “We simply can’t tolerate this. We have to do something.”
Growing percentages of students are taking—and passing—AP exams, The percentage of 11th and 13th greasers in public high school who score a 3 or better on at least one AP test has nearly doubled over the past decade from 7.6 in May 2004 to 13.2 in May 2014.
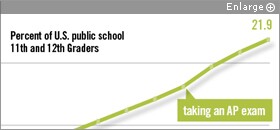
SOURCE: College Board
The news was brighter for the AP program. While the advanced courses seemed to be reaching only a fraction of the students who might succeed in them, participation in the AP program grew 3.8 percent, to 1.48 million students, in 2014. The growth included a 7 percent increase, to 355,400 students, for traditionally underrepresented minority students and a 7.3 percent jump to 408,800, for low-income students compared to 2013. Overall, 21.9 percent of public high school 11th and 12th graders took an AP exam, up from 20.1 percent last year.
In the past decade, the percentage of students receiving a passing score on an AP exam has nearly doubled, growing from 7.6 percent in 2004 to 13.2 percent in 2014, the report said.
For the PSAT/NMSQT, 3.7 million high school sophomores and juniors took the exam at school in the fall of 2013—increasing from 3.6 million the previous year. On average, students who take the PSAT do better on the SAT college-entrance exam, results have shown.
College Board officials view the PSAT as a “linchpin” among its programs, providing an early indicator of student progress. “It is the PSAT that lights the way so we can see what we need to propel students forward,” said Mr. Coleman. Following the exam, the College Board gives schools lists of students who have the potential to do well in AP courses based on scores in particular subjects. This year’s report shows that nearly 500,000 students have the aptitude to excel in an AP course from this year’s Class of 2016 taking the PSAT.
Between taking the PSAT and the SAT, the report found that 5 percent of juniors who were on target for career and college readiness fell off target by the fall of their senior year. There was also a group of seniors taking the test in 2014 who were close to meeting the SAT benchmarks (a 65 percent predictor of scoring at least a B- in a college freshman class), which officials say could likely have made the mark with additional instructional support.
Mr. Coleman said the College Board is positioning itself to be proactive in ensuring students’ successful transition to higher education. “One might say, ‘Hey, our job is to design good courses and then we are done. It is not our fault who ends up in these courses,’” said Mr. Coleman. “But it is the view of this College Board that while it may not be our fault, it’s most certainly our problem.”
Changing the Emphasis
The focus on using the tests as a tool for expanding college access and opportunities for students is a new direction for the College Board compared to just a few years ago, said Jim Hull, the senior policy analyst for the Center for Public Education at the National School Boards Association in Alexandria, Va. “The pipeline of preparation is following the blueprint used by ACT for a couple of decades,” he said. “It’s a combination of ACT taking over market share with the college-entrance exam and a shift in education policy with a huge focus on preparing all students for college and career readiness.”
Mr. Coleman said the College Board is committed to improving student performance with new initiatives. “We have enough assessments in this country. What we need are more opportunities,” said Mr. Coleman.
He highlighted the All In Campaign and AP STEM Access, aimed at getting broader representation of students in AP.
For example, the College Board continues to offer financial breaks to get more students to participate. This year, nearly 24 percent of students took the SAT using a fee waiver, up from 23 percent in 2013, according to the new report.
Mr. Coleman added: “We consider it within our shared power, working with school districts and educators throughout the country, to change these numbers.”
Still, racial gaps persist with AP and in SAT performance, with little change this year compared to last.
In 2014, just 15.8 percent of African-American students met the SAT benchmark, while 23.4 percent of Hispanics did and 42.6 percent of students overall, according to the report.
Of the public high school 11th and 12th graders who scored a 3 or higher on at least one AP Exam during 2014, about 62 percent were white, 15 percent Hispanic, and 4 percent African-American, the College Board reports. Yet, last year about 56 percent of all 11th and 12th graders enrolled in public school were white, 21 percent were Latino, and nearly 15 percent were African-American.


