Education

Multiple Yardsticks for Measuring Proficiency

By Erin M. Pollard — October 29, 2008 1 min read
  • Save to favorites
  • Print

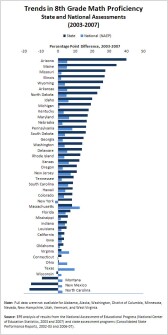
The No Child Left Behind Act calls for all students to achieve proficiency in reading and math by the 2013-14 school year. Although data from state testing programs show increasing proportions of students reaching or surpassing the proficiency bar, some experts question the validity of such gains. Those results have raised eyebrows, in part, because trend lines are rising much more rapidly on state-developed tests than on the U.S. Department of Education’s National Assessment of Educational Progress (NAEP), also known as The Nation’s Report Card. To explore this issue, the EPE Research Center performed an analysis comparing trends on NAEP and state-developed assessments between 2003 and 2007. Data were available for 42 states. In 16 states, gains in the percent of students reaching proficiency in 8th grade math were at least ten percentage points greater on their state-developed assessments than on NAEP. Overall, about 80 percent of states experienced a faster growth rate on their state tests, while only eight states had larger gains on NAEP than on state assessments.

For more state-by-state data on state assessments and other topics, search the EPE Research Center’s Education Counts database.
BRIC ARCHIVE

Related Tags:

Events

This content is provided by our sponsor. It is not written by and does not necessarily reflect the views of Education Week's editorial staff.
Sponsor
College & Workforce Readiness Webinar
From Exposure to Experience: Designing Accessible Work-Based Learning
Learn how schools can create meaningful experiences that help every student build skills, connections, and a clearer path to their future.
Content provided by Project Lead The Way
This content is provided by our sponsor. It is not written by and does not necessarily reflect the views of Education Week's editorial staff.
Sponsor
School & District Management Webinar
A Tale of Two School Districts: Forecasting Enrollment
Forecasting enrollment is hard. Here’s how two different districts are navigating times of change with data that considers the whole picture.
Content provided by Zonda Education
Reading & Literacy K-12 Essentials Forum Strategies to Create a Culture of Reading in Schools
Join this free virtual event to learn how teachers and school district leaders ensure students are reading enough.

EdWeek Top School Jobs

Teacher Jobs
Search over ten thousand teaching jobs nationwide — elementary, middle, high school and more.
View Jobs
Principal Jobs
Find hundreds of jobs for principals, assistant principals, and other school leadership roles.
View Jobs
Administrator Jobs
Over a thousand district-level jobs: superintendents, directors, more.
View Jobs
Support Staff Jobs
Search thousands of jobs, from paraprofessionals to counselors and more.
View Jobs

Read Next

Education Opinion The Education Wisdom Our Readers Keep Revisiting: Top 10
These opinion blog posts and essays have made a lasting impression on readers.
1 min read
Trendy halftone collage cutout elements. Laptop, rising arrow chart, gears, handshake, watch, magnifier. Idea, teamwork, brainstorming and success concept Modern retro vector illustration
Cristina Gaidau/iStock
Education Opinion The Opinions EdWeek Readers Care About: The Year’s 10 Most-Read
The opinion content readers visited most in 2025.
2 min read
Collage of the illustrations form the top 4 most read opinion essays of 2025.
Education Week + Getty Images
Education Quiz Did You Follow This Week’s Education News? Take This Quiz
Test your knowledge on the latest news and trends in education.
1 min read
Education Quiz How Did the SNAP Lapse Affect Schools? Take This Weekly Quiz
Test your knowledge on the latest news and trends in education.
1 min read