States are increasingly making their academic tests tougher to pass, and the Common Core State Standards are the key force driving those higher expectations, according to a study released Wednesday.
The study, published in the journal Education Next, finds that since 2011, 45 states have raised the levels at which students are considered “proficient” on state tests. Thirty-six of the 45 did so within just the last two years.

The report is the seventh in a series that examines states’ proficiency rates over the past decade. Each study compares the proportion of students that scored “proficient” on states’ tests in math and English/language arts to the proportion that scored proficient in those subjects on the National Assessment of Educational Progress, or NAEP.
The new analysis, conducted by researchers from Harvard University’s Program on Education Policy and Governance, compares states’ test scores from 2014-15 with the 2015 NAEP in grades 4 and 8. It assigns each state a letter grade to reflect how closely its proficiency rates mirror those on NAEP, which is widely considered the gold standard in academic assessment.
Higher Grades
Twenty-four states earned A’s overall for closely reflecting NAEP’s definition of proficiency in 2015. In a 2011 version of the EdNext study, only three states earned A’s. In the 2005 version, only six states did. Eighteen states’ ratings jumped by two letter grades or more since 2013.
“In short,” writes researcher Paul E. Peterson, with co-authors Samuel Barrows and Thomas Gift, “standards have suddenly skyrocketed.”
“It is a hopeful sign that proficiency standards have moved in the right direction,” they write. “If student performance shifts upward in tandem, it will signal a long-awaited enhancement in the quality of American schools.”
Here’s how the authors charted the change in states’ grades for NAEP-like proficiency standards:

Iowa, Nebraska, Oklahoma, Texas, and Virginia got particularly low marks—C’s and D’s in 4th and 8th grade reading and math—for continuing to produce high proficiency rates on their tests, in contrast to NAEP’s findings. Sixteen states got A’s in both subjects and at both grade levels.
Achieve and the Collaborative for Student Success on Thursday are expected to release their own report on states’ proficiency levels—an update to their initial report last May.
Georgia is a state that has drawn praise for raising its proficiency standards. In 2014-15, it switched to new tests that required students to explain their thinking rather than answer only multiple-choice questions. When those results came in, Georgia saw proficiency rates drop from the 90s into the 30s and 40s, close to its NAEP proficiency rates.
“The old tests were sugary sweet candy that made us feel good, but didn’t give us any nutrition,” said Georgia’s assessment chief, Melissa Fincher.
She believes the new tests are pegged more closely to the skills students need to be competitive in work and school in the future. They’re also more valuable instructionally, since the students’ explanatory answers can produce deeper, more insightful information that will help teachers tailor their teaching to students’ needs. Fincher said.
Education Week‘s Test-Score Database
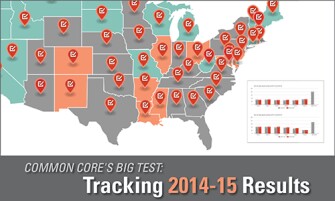
Education Week has built a warehouse of all the states’ 2014-15 test scores, and it mirrors what EdNext is reporting (and what Achieve will report on Thursday): Proficiency rates on state tests are down. Way down. It isn’t uncommon to see states that adopted more difficult tests, to reflect the new standards, plummet from proficiency rates in the 70s and 80s to rates in the 30s and 40s. Check out our 2014-15 test-score database and map, a project led by my colleague Andrew Ujifusa, with a little help from me.

Why did we do this? And why are other organizations, like EdNext and Achieve, tracking this? (The National Center for Education Statistics has done “mapping” studies for years, too, showing the gap between states’ proficiency rates and their performance on NAEP.)
It’s because everyone knew that 2014-15 was going to be a banner year for the use of new assessments aligned to the common core, or to other rigorous, college-ready standards. State leaders were worried; They knew that students wouldn’t perform as well on tougher tests. Fearing a public relations disaster, state officials had been warning that results might not be pretty. In coordinated public-relations campaigns, they’ve been trying to calm jittery policymakers, educators, and parents by telling them that lower scores in the first year of a new, more difficult test, were to be expected.
To some activists, higher numbers of students failing to make the proficient mark is just a sign that tests are holding too much power in education. To others, it’s a sign of a more honest approach to telling the public how well students are learning.
For years, Achieve and others lamented the gap between what state tests say and what NAEP reported about student achievement. The newest round of proficiency rates, many of them in the 20s and 30s, are a more accurate reflection of how well our schools are doing, these activists argue.
