
For policymakers and taxpayers alike, school finance is an uneasy balance between effort—how much they’re willing or able to spend—and equity, or how fairly that money gets spread around to schools and districts.
The most recent analysis from the Education Week Research Center shows that the nation as a whole and many individual states are doing a far better job on the equity side of the equation than they are on the sheer spending side of things.
The analysis, based on four measures of overall spending and four equity metrics, gives the nation a grade of C this year in school finance, with a score of 74.9 out of 100 possible points. That’s up 0.5 points since last year. Still, nearly half the states (24) finish with grades between C-minus and D-minus.

And the scores are significantly higher on funding equity for the nation as a whole (B-plus or 86.8) than they are for spending alone (D or 63.0). Vermont (C+) and Alaska (C) are the only states to receive grades below B-minus for equity, but 25 states get F grades for spending.
The School Finance analysis is based on data from 2016, the most recent available from the federal government. Reliance on uniform federal data sources means that more recent developments are not reflected in the grading. The Education Week Research Center uses federal data because it allows for state-by-state comparisons that are difficult if not impossible to make with information produced at the state or local levels.
Based on that data, Wyoming holds the No. 1 spot on school finance in the Quality Counts 2019 rankings, earning the only A (92.8). New York posts an A-minus and is followed by four states at B-plus. At the other end of the scale, Idaho receives a D-minus and the nation’s lowest numeric score (60.6). Two other Western states—Arizona and Nevada—also have grades of D-minus.
Most analyses are adjusted for regional cost differences. They are also adjusted for concentrations of low-income students and students with disabilities, because both of those groups typically cost more to educate in an equitable manner.
Grades are calculated using a best-in-class approach that gauges a state’s performance on each metric in comparison to the nation’s top-ranked state on that same indicator. The top state receives 100 points for the indicator. Other states earn points in proportion to their performance as benchmarked against the national leader. The overall A-F letter grades reflect the average of numerical scores on a traditional 100-point scale.
Among the takeaways from this year’s data:
Wyoming Continues to Perform Well. California and Washington Make Gains
For the past decade, Wyoming has almost always had the highest grade for school finance. The state ranks first for spending and seventh for equity. Other states with high overall grades tend to rank well for spending, but more poorly for equity. Wyoming is the only state to make the top 10 lists for spending and equity alike.
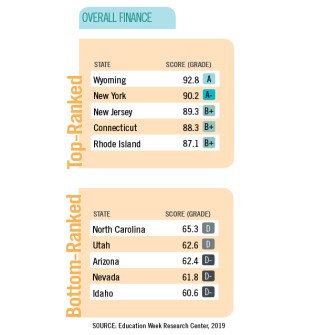
Moreover, the state scored in the top 10 in the majority of the eight spending and equity categories. For example, it ranked third in the nation on a metric that grades states based on the degree to which they provide additional funding to poorer districts. At $18,090, Wyoming’s per-pupil spending is third-highest in the nation (adjusted for regional cost differences). All of its students are in districts where per-pupil spending is at or above the national average. That’s true of only six other states and the District of Columbia.
States like Wyoming and New York have performed well over time in their overall finance performance. However, two states stand out for the improvements they have made in the past year: California gained 3.3 points, and Washington gained 2.5, the only two states whose scores improved by 2 points or more between 2018 and 2019. Both made improvements in the spending category.
Idaho Ranks Last, While Alaska and West Virginia Experienced the Largest Drops
Wyoming’s neighbor, Idaho, received the nation’s lowest school finance score, a 60.6 or a D-minus. The state struggles with both spending and distributing funding across districts. Specifically, Idaho has one of the nation’s lowest percentages of districts that are at or above the national average in per-pupil spending. The state also exhibits inequitable spending patterns such as funding more affluent districts at higher rates.
Alaska (-2.9) and West Virginia (-1.9) had the largest declines in their overall school finance scores. Last year, Alaska was one of the states that improved the most, ending up with a B (85.0). However, Alaska now has a grade of B-minus (82.1). The state’s ranking declined from ninth to 12th. The change was driven by decreases in per-pupil expenditures, which dropped from $20,640 in Quality Counts 2018 to $17,872 this year. West Virginia’s scores decreased in the past year in both equity and spending. A smaller share of students attend districts in which per-pupil spending meets or exceeds the national average. Interdistrict disparities have also widened.
States That Score Well on Spending Tend to Score Poorly on Equity and Vice Versa
Florida highlights this disconnect. The state is ranked first for equity, receiving the sole A for the indicator, but 45th for spending, with an F.
Alaska is an example of a state that spends a great deal, yet fails to distribute its educational funding in an equitable manner. While it has the nation’s seventh highest spending score, earning an A-minus (90.9), it ranks last (73.3, a C) in terms of overall equity. Although it struggles on most equity indicators, Alaska is the only state in the nation to provide higher funding for property-poor districts than for their more affluent counterparts.
Vermont leads the nation for per-pupil spending ($20,540 adjusted for regional cost differences). It also devotes a larger share (5.4 percent) of its total taxable resources to education than any other state. In stark contrast, Vermont ranks 48th on equity, with the state near the bottom on three of the four equity indicators.


