Data played an important role in 2018, giving researchers and educators insight into current events ranging from the status of Puerto Rico’s schools in the wake of Hurricane Maria to principals’ views on technology and social media. The charts, graphs, maps, and visualizations below all feature data that were released this year by the Education Week Research Center and other organizations, and convey some big takeaways about U.S. schools, students, and teachers in 2018.
1. We Graded States on Their School Systems. Overall They’re Mediocre
Education Week‘s annual state-by-state assessment of public education paints a portrait of middling performance overall with patches of high achievement. See how your state did this year:
Related reading:
Quality Counts 2018: School Finance Report & Rankings
Quality Counts 2018: K-12 Achievement and Chance for Success
2. There Were 24 School Shootings With Injuries or Deaths in 2018
School shootings—terrifying to students, educators, parents, and communities—always reignite polarizing debates about gun rights and school safety. To bring context to these debates, Education Week journalists tracked the shootings on K-12 school property this calendar year that resulted in firearm-related injuries or deaths. There were a total of 24 school shootings.

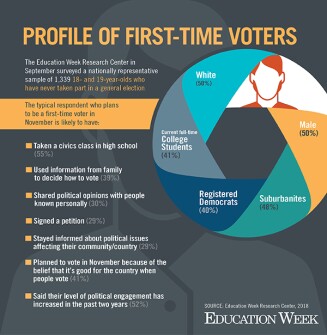
3. Most Young Registered First-Time Voters Identify as Democrats
Students are coming of political age in an era of deep partisan division, immersed in a social-media swirl of information and misinformation. Using a survey conducted with support from the Education Writers Association, Education Week created a profile of first-time voters.
4. Schools Have Seen a Steep Decline in Librarians
The nation’s public school districts have lost 20 percent of their librarians and media specialists since 2000, from more than 54,000 to less than 44,000 in 2015, according to an Education Week Research Center analysis of federal data. Many districts lost librarians even as student populations grew by 7 percent nationwide.
5. Dozens of Schools Are Still Named After Long-Dead Confederate Leaders
This map from the Education Week Research Center shows where school with names tied to the Confederacy are located. Hover over the dots for more information, including when the school was built or named, and the percentage of non-white students at the school.
6. Most States Require History, But Not Civics
High school students spend far more time in school learning about America’s history than they do learning about its civic values, according to a 50-state survey by Education Week. The results show that while most states require students to study civics, just eight require them to take a yearlong civics or government class in order to graduate.
7. Hundreds of Puerto Rico’s Schools Were Forced to Close After Hurricane Maria
In response to Hurricane Maria, as well as falling enrollment and the government’s long-term financial woes, the Puerto Rico Department of Education plans to close nearly 25 percent of its public schools before the 2018-19 school year begins. Under the plan, 263 schools will close and 847 schools will remain open.
On the map below, zoom in to see the distances between the closing schools and those scheduled to receive students. Hover over each school to view its name, region, municipality, and grade levels.
See more of our coverage of how Hurricane Maria impacted schools in 2018, including an overview of Puerto Rico’s education system in numbers.
8. The Growth in Special Education Students Is Outpacing Teacher Supply
An analysis of federal data by the Education Week Research Center shows that while the number of special education teachers was dropping by more than 17 percent over the past decade, the number of students with disabilities ages 6 to 21 declined by only about 1 percent over the same time period.

9. Principals Are Concerned About Student Tech Use
Even as districts rush to give every student his or her own Chromebook or iPad, 61 percent of principals say their students are getting “the right amount” of screen time in school.
Principals are also twice as likely to say they’re “extremely concerned” about students’ social-media use at home than their social-media use at school—even as class assignments and homework increasingly move online, creating new opportunities for children to become distracted by YouTube and other popular digital platforms.

Click here for an interactive version of this chart.
10. How Long Do Kids Have to Stay in School? Longer Than They Did 5 Years Ago
Many states have significantly raised their mandatory-attendance age in the last five years, new federal data show. See where your state stands when it comes to mandatory school attendance as well as the number of years free education is offered:

Click here for an interactive version of this chart.
List Compiled By: Sasha Jones | Design: Education Week