skoolboy doesn’t know who was the first to say that the true measure of a society is how it treats its weakest members, but it’s an appealing proposition. All societies have children and adults who vary in their economic, social and cultural status within the society. In virtually every modern society, the more advantaged, as a group, do better than those with lower status, although individuals can rise or fall in relation to their peers. Today’s visit to the Olympics looks at the relationship between a child’s socioeconomic status and proficiency in math and science across countries.
PISA 2006 created an index of Economic, Social and Cultural Status (ESCS), which is based on a parent’s occupational status (using a standard international scale); the highest level of a parent’s education, in years of schooling completed; an index of family wealth (e.g., number of computers, automobiles, and televisions; whether the child has own room); an index of home educational resources (e.g., a dictionary, a calculator); and an index of possessions in the home representing “classical” culture (e.g., classical literature, works of art). The index was standardized to have a mean of 0 and a standard deviation of 1 for OECD countries. Keep in mind, though, that PISA sampled youth currently enrolled in school as 15-year-olds in the participating countries, and in some countries (e.g., Mexico, Turkey) fewer than 60% of youth at this age are still in school. (In most OECD countries, more than 90% of this age cohort is still enrolled.) Out-of-school youth are, on average, of substantially lower socioeconomic status than youth still in school at age 15.
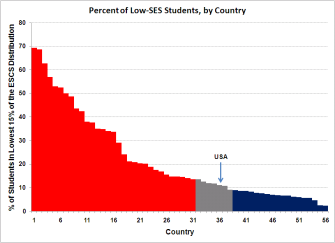
The figure below shows the percentage of 15-year-olds in each of the PISA countries and economies whose ESCS is in the bottom 15% of ESCS among students in OECD countries. Countries are arrayed from highest to lowest, and columns in red represent significantly higher percentages than the U.S. percentage of 11%; columns in blue represent significantly lower percentages than the U.S.; and grey columns are statistically indistinguishable from the U.S. Ten countries, headed by Thailand, Indonesia, Turkey and Tunisia, have more than 40% of the PISA participants in this low-ESCS category. Three countries—Norway, Iceland and Canada—have fewer than 5% in the low-ESCS category. Based on the ESCS scale, which is intended to be standardized across countries, there are many countries with higher concentrations of low-SES students than the U.S.

The next figure shows the correlation between ESCS and mathematics proficiency for each PISA country and economy. The correlation can range from -1.0 to +1.0, with 0 representing no correlation. A positive correlation indicates that students with higher ESCS score higher, on average, in math proficiency than students with lower ESCS. The presence of such a correlation is almost universal—only in Azerbaijan is there a realistic possibility of no correlation. Columns in red represent countries with a significantly higher correlation between ESCS and mathematics proficiency than the U.S. correlation, which is .42. Blue columns represent countries that have significantly lower correlations than the U.S., and grey columns are countries that are statistically indistinguishable from the U.S.

Only Chile and Hungary have significantly higher correlations than the U.S., whereas 28 countries have significantly lower correlations than the U.S. does. Along with Azerbaijan, Macao-China, Hong Kong-China, Canada, Iceland, Norway, Montenegro, and the Russian Federation all have a correlation between ESCS and mathematics proficiency that is less than .30.
The “sweet spot” for schools, districts, and countries is a configuration in which average achievement is high, and the achievement gap between the more and less advantaged is low—a configuration that some would describe as both excellent and equitable. skoolboy’s summary based on the PISA data: the U.S. isn’t very sweet.
A topic for another day: What should the correlation between a student’s socioeconomic status and his or her school achievement be? Is it possible that some degree of correlation between socioeconomic status and school achievement is appropriate? Or should we not rest until we’ve driven the correlation to zero?