Return to main story, “Guiding Hand.”
Chart 1: Current Instructional-Leadership Practices
SOURCE: Education Week Research Center

Chart 2: District-Level Decisionmaking
SOURCE: Education Week Research Center

Chart 3: School-Level Differences
SOURCE: Education Week Research Center

Chart 4: The Influence of No Child Left Behind
SOURCE: Education Week Research Center
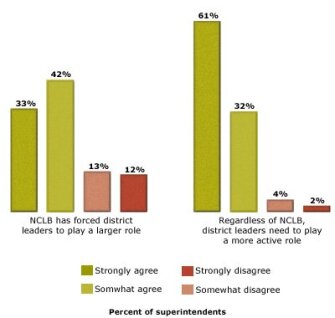
Chart 5: Obstacles to Instructional Leadership
SOURCE: Education Week Research Center

Chart 6: An Emergin Trend
SOURCE: Education Week Research Center

Chart 7: Data Differences
SOURCE: Education Week Research Center

Chart 8: Impact on Achievement A Matter of Size
SOURCE: Education Week Research Center

Chart 9: Practice vs. Perception
SOURCE: Education Week Research Center


