
Corrected: Due to a typographical error, an earlier version of this story misstated information about the relationship between test scores and family income. It should have said that scores for children from families with more than $200,000 incomes rose 26 points.
Scores on the SAT declined or stagnated in the last year, according to results released last week by the College Board.
The New York City-based nonprofit organization’s annual, national report shows that the mean mathematics score for the class of 2009 was 515, the same as for the class of 2008. In reading, it was 501, one point lower than for students in the class of 2008. The mean writing score fell by one point as well, to 493. Each section is scored from 200 to 800 points.
Both sections have declined from their recent high points in 2005, the last test before the College Board added a writing section and made other changes, including higher-level math questions. The reading score is seven points lower than it was in 2005, and the math is five points lower.
About 1.53 million students in the class of 2009 took the SAT, only 11,269 more than the previous year, an increase of less than 1 percent. The ACT, a college-entrance exam designed by Iowa City, Iowa-based ACT Inc., saw a faster rate of growth in that period, by 58,500 additional students, or 4 percent, to 1.48 million students. Five states, including two that just began the practice last year, require all students to take the ACT, but only one, Maine, requires the SAT of all students.
ACT results, released Aug. 19, showed most students are not prepared for college in all tested subjects.(“Scores on ACT Show Majority of Students Not College-Ready,” Aug. 26, 2009.)
Over the past decade, SAT reading scores have declined by 4 points, and math scores have risen by 4. The writing portion of the test has been administered for only four years.
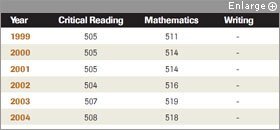
SOURCE: College Board
The pool of SAT test-takers continued to grow more ethnically and racially diverse. College Board President Gaston Caperton said he is “tremendously encouraged” by that trend. Students of Hispanic descent, for instance, made up 13.5 percent of the testing group in 2009, compared with 7.8 percent a decade ago.
Laurence Bunin, the College Board’s senior vice president for the SAT program, said yearly fluctuations are to be expected, and that the “stability” of scores over time is important because they can decline when a test-taking pool gets larger and more diverse.
Mr. Bunin highlighted a 4-point increase in math scores in the last 10 years, saying it is “meaningful” because that upward trend extends back three decades. But he said a similar 4-point decrease in reading scores over the same period was not meaningful because it was “not as clear” a trend as in math.
SAT results showed persistent racial and ethnic gaps. Black students trailed white students, who had the highest reading scores of any ethnic or racial group in that subject, by 99 points. Those of Mexican heritage scored lower by 75 points, and those of Asian descent lagged by 12 points. In math, Asian students posted the highest scores, with white students trailing them by 51 points, black students lagging by 161 points, and students of Puerto Rican descent behind by 137 points.
College Board officials said students who score well on the SAT have three things in common. Those who took a “core curriculum” of at least four years of English, three years of math, three years of natural science, and three years of social studies scored more than 44 points higher on each section than those who had not. Students who took honors or Advanced Placement courses outscored the national student average by 59 points in writing, 60 points in reading, and 79 points in math.
And the 82 percent of students who took the PSAT, a preliminary test typically administered to 10th and 11th graders, scored significantly higher than those who had not. College Board officials attributed that difference to students having “familiarized” themselves with the SAT.
The scores showed pronounced correlations between students’ achievement and their family income and education levels. Mean scores on each of the three sections were more than 100 points higher for students whose annual family incomes topped $200,000 than for those whose families earned $20,000 to $40,000, for instance. There were score gaps of more than 50 points between students whose parents have only a high school diploma and those whose parents have earned bachelor’s degrees.
An analysis by the National Center for Fair and Open Testing, known as FairTest, based in Boston, Mass., showed that between 2008 and 2009, aggregate scores for children whose families earned $20,000 or less rose only one point across all three subject areas, while those for children from family incomes of more than $200,000 rose 26 points. Wayne Camara, the vice president of research and development for the College Board, said that such gaps indicate more rigorous academic preparation in children of higher-income and better-educated families.
FairTest’s public education director, Robert Schaeffer, said the SAT results show that “test-driven reform” is not producing better teaching and learning.
Former West Virginia Gov. Bob Wise, the president of the Alliance for Excellent Education, a Washington-based group that advocates for high school improvement, said the SAT scores “confirm a lot of what is important in high school reform”—the importance of rigorous coursework and high expectations.
The growing size and diversity of the test pool indicate that educators are setting higher expectations for more students, he said, but the scores themselves show the need to boost academic success, especially in light of President Barack Obama’s call for the United States to have the greatest share of college graduates in the world by 2020.
“The SAT results are important to discussions taking place in Congress and statehouses right now,” Mr. Wise said. “People are having to make these budget-conscious decisions. And the place you don’t want to cut back is in rigor in the classroom.”


