How Does the U.S. Stack Up Against Other Nations?
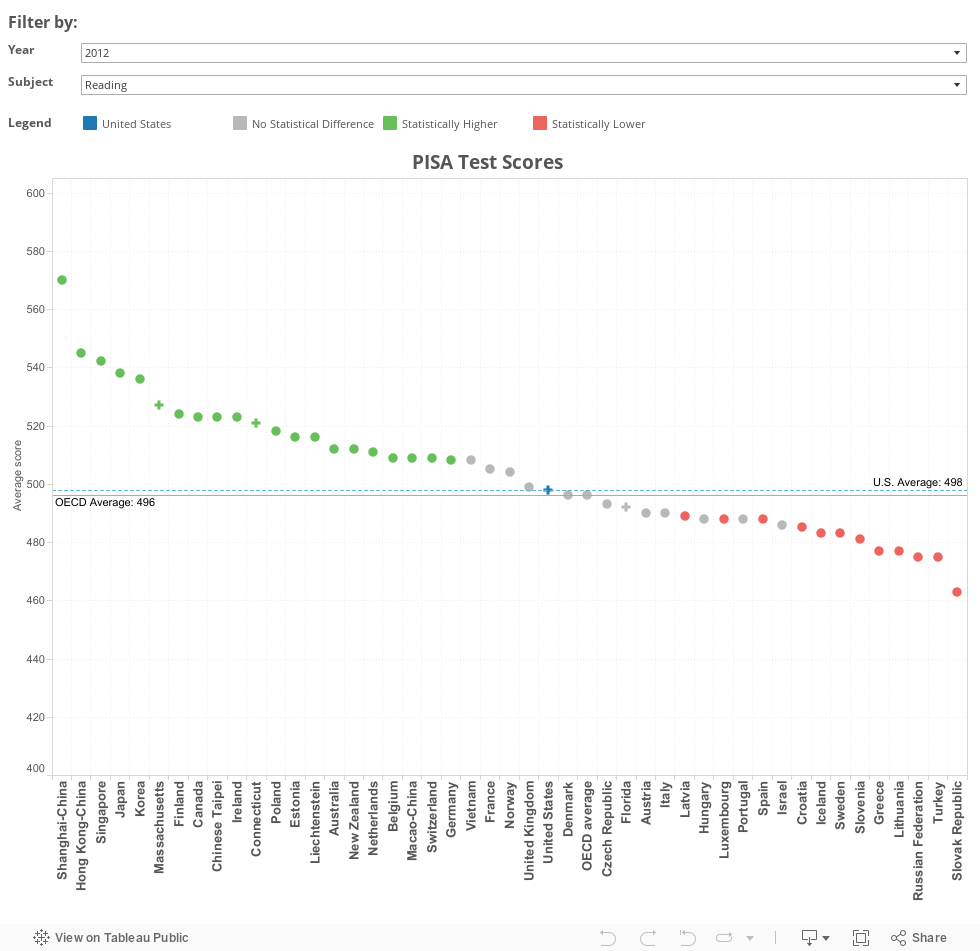
A new set of international achievement data in math, reading, and science shows that U.S. scores remained flat since 2009, while some other nations posted gains. The PISA report also provides a look at how 15-year-olds in three U.S. states--Connecticut, Florida, and Massachusetts--fared on the global exam.
To explore the test data, use the filters below to narrow your choices down by year and subject. The charts indicate whether scores are statistically higher, the same, or lower than the U.S. average. Hover over the charts to see more detailed information.
Note: Countries with test scores below 450 on the PISA scale have been omitted.
SOURCES: National Center for Education Statistics; Program for International Student Assessment (PISA)
Reporting & Analysis: Liana Heitin | Design & Visualization: Doris Nhan
A version of this article appeared in the December 11, 2013 edition of Education Week as How Does the U.S. Stack Up Against Other Nations?