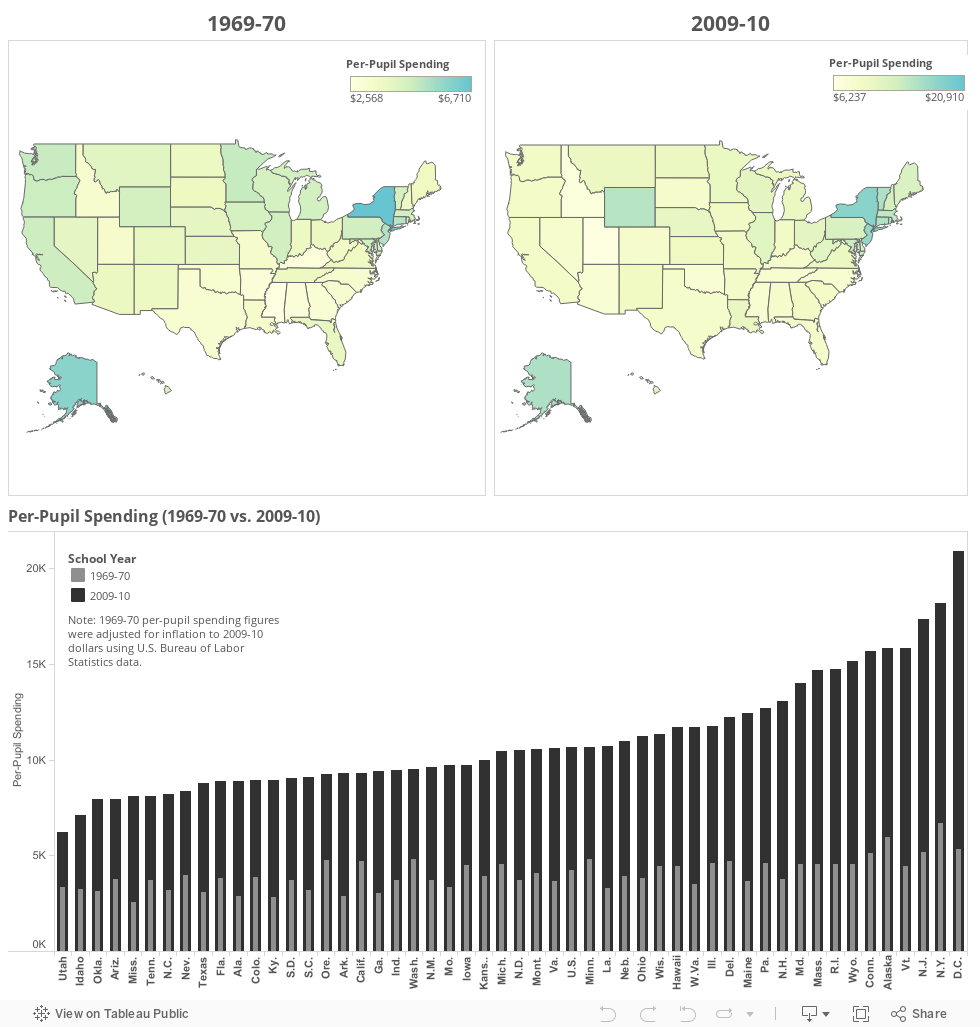
War on Poverty: Mapping Inequality
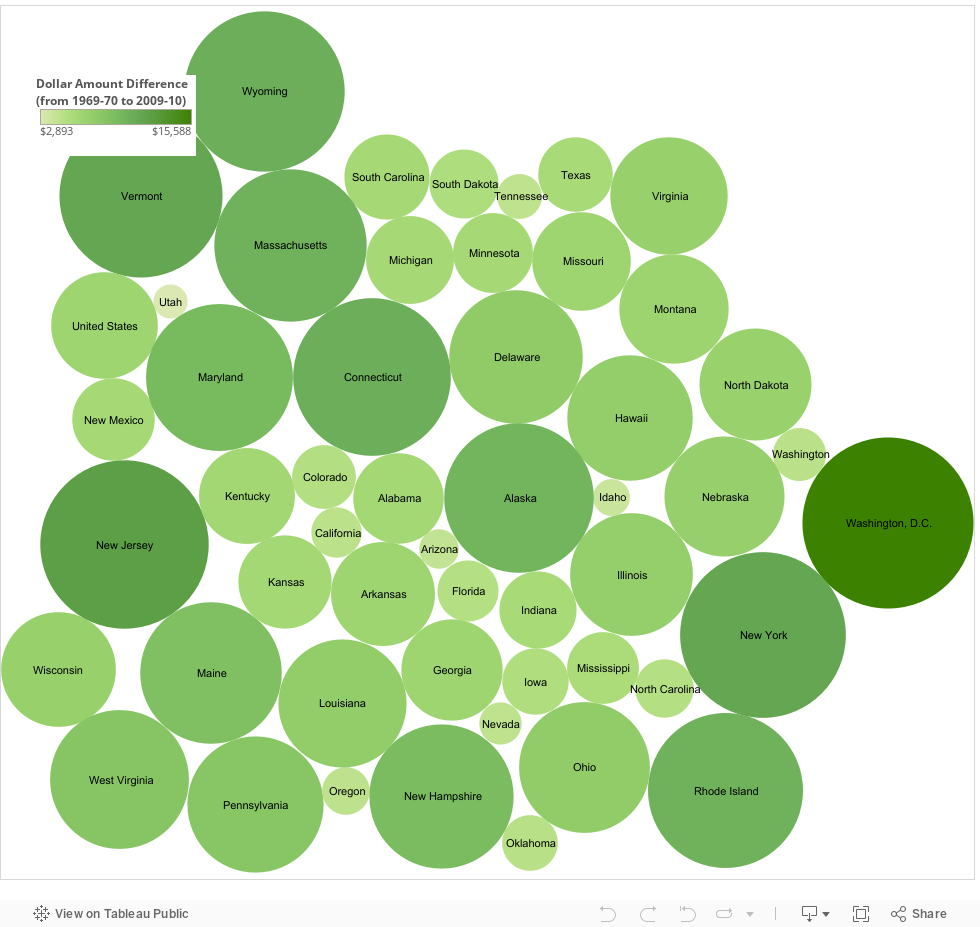
Since the 1960s, school spending across the country has skyrocketed. During the 2009-10 school year, some states, however, spent vastly more money per student than others.
A version of this article appeared in the January 22, 2014 edition of Education Week as Mapping Inequality