The 12th annual edition of Education Week’s Quality Counts continues the cradle-to-career framework launched in last year’s report. But it also reintroduces some of the categories in which we have graded states in the past, though some of the indicators and the grading have changed.
The cradle-to-career perspective emphasizes the connections between K-12 education and other systems with which it intersects: preschool education, other social and economic institutions, and further education and training.
To emphasize this approach, the Editorial Projects in Education Research Center last year created two new state-performance measures: the Chance-for-Success Index and the K-12 Achievement Index.
These indicators, respectively, capture key learning foundations and outcomes at various stages in a person’s life and the performance of the states’ public schools. Coupled with that heightened attention to outcomes, the 2007 edition of Quality Counts examined a series of policies that states could pursue to better align public education from preschool to postsecondary education and into the workplace.
Even as we introduced those new measures last year, we put two of our traditional policy categories on hold: school finance and efforts to strengthen the teaching profession.We spent the past year revising those indicators to ensure the report reflects the field’s best and most current thinking. Both categories have returned for this year’s report. Indeed, teaching is the special theme of Quality Counts 2008.
All of the indicators in this year’s report are graded, unlike in the past, when we included some indicators for information purposes only. Quality Counts has always evolved over time, adding and subtracting indicators to better capture the most important and timely movements in state education policy, so the report’s letter grades should not be compared from year to year. This caveat is particularly salient for Quality Counts 2008, given the many changes in the report since 2006, the last time we graded states.
Most of the 50-state indicators that appear in Quality Counts are based on original data analyses and state-survey data from the EPE Research Center. But we also draw on published information from a number of outside organizations. The methodology section provides a more detailed description of our indicators and our procedures for grading the states. (The District of Columbia will be treated as a state throughout this analysis.)
Overall State Grades
States were awarded overall letter grades based on their ratings across six areas of performance and policy: chance for success; K-12 achievement; standards, assessments, and accountability; transitions and alignment; the teaching profession; and school finance. The average grade for Quality Counts 2008 is a C.
| Data Download | |||||||||||||||||||||
|---|---|---|---|---|---|---|---|---|---|---|---|---|---|---|---|---|---|---|---|---|---|
|
Leading the pack, three states received B’s: Maryland, Massachusetts and New York. At the other end, six states were awarded grades of D-plus: Idaho, Mississippi, Nebraska, Nevada, Oregon, and the District of Columbia.
Some states performed consistently well or poorly across the full range of categories. But a closer examination of the rankings reveals that most states posted a strong showing in at least one area.
This suggests that while broad evaluations of state performance can be useful, a closer reading of the results will provide a more nuanced perspective on the educational condition of the nation and of individual states.
Chance for Success
The states have been graded in this category using a “best in class” rubric. The leading state on a particular indicator receives 100 points; other states earn points in proportion to the gaps between themselves and the leader. We then averaged points across the 13 indicators to arrive at the final numerical score and letter grade.
Under a best-in-class grading model, the implicit frame of reference for each indicator is the top-performing state. A state’s overall score on the whole set of indicators can, likewise, be gauged against a similar, if perhaps hypothetical, standard. Namely, 100 points on a best-in-class scale would correspond to a state that finished first in the nation on each and every measure.
The EPE Research Center graded the states across the six categories of state performance and policymaking tracked in Quality Counts 2008. The nation as a whole earned a C. Topping the state rankings are Maryland, Massachusetts, and New York, each earning a B. Five states and the District of Columbia received grades of D-plus.
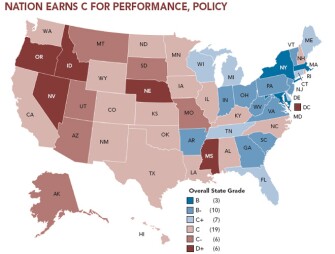
SOURCE: EPE Research Center, 2008
No state earned a perfect score, although several fared very well. Massachusetts leads the nation with the only A, followed by Connecticut, New Hampshire, and New Jersey, each earning an A-minus.
Last year’s report used the same indicators, but a different scoring method. Even so, the four states topping the nation in 2008 were also among the highest-ranked states in 2007. At the opposite end of the spectrum, four states received a grade of D-plus: Louisiana, Mississippi, Nevada, and New Mexico. The average grade for the nation is a C-plus.
The Chance-for-Success Index captures a combination of factors, including preparation in early childhood as well as school performance and educational and economic outcomes in adulthood. However, formal education proves to be the driving force behind state rankings.
For example, we can attribute about three-quarters of the gap between Massachusetts’ first-in-the-nation finish and Hawaii’s average score to differences in school participation and performance.
In other words, while states differ to some degree in the opportunities their residents have for learning during the early years and for job prospects in adulthood, how well states deliver on the promise of elementary and secondary education proves to be the most important driver of residents’ opportunities.
K-12 Achievement
This year’s report expands on the set of achievement indicators used in 2007. Comprising 18 distinct state-achievement measures, this category now assigns equal weight to current levels of performance and changes over time.
It also places a greater emphasis on equity, by examining both poverty-based achievement gaps and progress in closing those gaps. As a result of those shifts, readers should not compare the K-12 achievement scores for the 2007 and 2008 editions of the report.
A best-in-class rubric is also used to grade states on the K-12 Achievement Index. The top-achieving state, Massachusetts, earned 85.2 points, and a B on our grading scale. Maryland was the only other state to receive a B, while New Jersey earned a B-minus. The average grade for the nation is a D-plus, with seven states posting grades of D-minus or lower.
Those results suggest that no state consistently demonstrates excellence across the three elements of the Achievement Index: status, change, and equity.
Among the top-ranked states, most fare well for current levels of achievement and improvements over time, but rather poorly on equity. Massachusetts, for example, finishes first on current achievement and gains, but 47th in terms of achievement disparities between poor and nonpoor students and movement to close poverty gaps. By contrast, Florida, which finishes seventh in the nation overall, ranks 31st for current achievement but emerges as one of the top states on gains and equity.
Standards and Accountability
With an average grade of B, states make a stronger showing in this area than in any other graded category. Their performance attests to the strong roots that standards-based education has put down since the 1990s.
As of this year’s survey, every state had adopted academic standards in English, mathematics, and science; only Iowa lacked standards in history. A majority of the states (38) also revise their standards regularly.
Forty-three states provide supplementary curriculum resources to complement their content standards in core academic areas. But an analysis by the American Federation of Teachers suggests that all standards are not created equal. In each subject, fewer than half the states have standards judged clear, specific, and grounded in content at every grade level.
All states now engage in a significant amount of annual student testing, in part because of the No Child Left Behind Act. The 6-year-old federal law requires states to align their tests with their academic- content standards, but permits states to determine the types of test items they will use.
Multiple-choice questions remain a mainstay of state testing systems, used in every grade span by all states but Nebraska. Test items requiring students to provide short answers are used at all grade levels in 28 states and the District of Columbia. Only about half the states (24) require students to write extended responses in subjects other than English. During the 2007-08 school year, two states (Georgia and Kentucky) are assessing students using portfolios of their work.
States have become increasingly interested in analyzing individual student learning over time using what are called growth models, an approach that requires tests to be “vertically equated,” or scored on the same scale from grade to grade. About half the states (24) now have vertically equated tests in grades 3-8 for English and math; 21 states have also developed standards-based formative assessments or banks of test items that enable local educators to assess students’ learning on a more frequent basis.
Though the NCLB law requires states to adopt school accountability systems, just over half the states (26) have developed school rating systems that go beyond “adequate yearly progress,” the key gauge of success under the law. A majority of states hold all schools accountable for their performance, not just the schools that receive federal Title I funding for disadvantaged students. Thirty-nine states offer assistance to low-performing schools, while 32 states impose some type of sanction.
Transitions and Alignment
This year, for the first time, we grade states on their efforts to align K-12 schooling with earlier and later stages of education and the workplace, indicators we first introduced in 2007.
With an average grade of C, many states have made substantial strides in bridging these critical education transitions. The leading states in this area—Arkansas, Georgia, Maryland, Michigan, New York, Tennessee, and West Virginia—have implemented at least 10 of the 14 alignment policies tracked in this year’s survey. By contrast, Idaho and Utah have enacted just two such policies, and Nebraska only one.
While nearly all states have early-learning or kindergarten standards aligned with those for the elementary grades, and about half the states have defined work readiness, states have paid less attention to readiness for college. Only 15 have a definition of college readiness in effect for the 2007- 08 school year, and just three require all public school students to complete a college-preparatory curriculum to earn a diploma.
The Teaching Profession
Quality Counts 2008 reintroduces our indicators on the teaching profession. The new, more comprehensive framework highlights state accountability for quality, incentives to attract and keep talent and allocate it equitably across schools, and efforts to build and support teaching capacity. South Carolina earned an A-minus, the highest grade awarded. But many states have a long way to go, with nine states and the District earning grades of D or lower.
Most states, for example, require prospective teachers to pass basic-skills and subject-knowledge tests. But only five states (Arkansas, Florida, Georgia, Hawaii, and New Mexico) require all schools to notify parents when their child is in a class taught by a teacher not qualified in that subject.
And while 43 states mandate some form of teacher evaluation, only 12 require that such evaluations occur at least annually, and 12 also require that the evaluations take student achievement into account.
States can also strengthen their teaching workforces by attracting promising candidates, offering incentives to encourage stronger performance, and strategically allocating high-quality teachers to high-needs schools. Alternative routes for nontraditional candidates and licensure-reciprocity agreements with other states are now common; they are found, respectively, in 46 and 37 states, as well as the District of Columbia, for the 2007-08 school year.
But the state of play on teacher compensation is generally not encouraging. An original analysis by the EPE Research Center finds that the average U.S. public school teacher earns a salary 88 percent as high as individuals in such comparable occupations as accounting, architecture, occupational therapy, and registered nursing. In fact, teacher earnings fail to reach the parity mark in 40 states and the District, with the least-competitive teacher salaries found in North Carolina and Missouri, where a teacher earns less than 80 cents for every dollar earned by a comparable worker.
Thirty-eight states now provide incentives for teachers to earn certification from the National Board for Professional Teaching Standards. But only 17 states have incentives for teachers to assume leadership roles outside their classrooms, while only seven states have pay-for-performance programs. And while a majority of states now have data systems able to monitor teacher qualifications and assignments, considerably fewer actively target the allocation of teachers to high-needs schools or subjects.
States can also support the career development of new teachers through formal induction and mentorship programs, which are mandatory in 22 and 25 states, respectively. But only North Carolina and South Carolina reduce the workload during a teacher’s formative first year. All teachers, veteran and novice, can benefit from well-crafted professional- development policies. But while 41 states have standards for professional development, just 16 require districts to actually set aside time for professional development.
Research has often pointed to the critical contribution of school leadership and working conditions to teacher effectiveness, job satisfaction, and retention. But while 47 states and the District have standards for principal licensure, only 14 require new principals to take part in an induction or mentoring program. Fewer than half of all states (22) routinely monitor the condition of school facilities, a major concern cited by teachers. Only three states—North Carolina, Rhode Island, and South Carolina—publicly report school-by-school information about working conditions or school climate based, in part, on teacher surveys.
School Finance
Indicators in this category also return for this year’s report. States are graded across the dual dimensions of school spending and the equitable distribution of resources. But our focus is not on sheer dollars spent. Rather, educational expenditures are evaluated against some relevant criterion or benchmark, such as regional differences in costs, the national average for per-pupil expenditures, or the total size of a state’s budget.
The nation overall earns a C-plus on school finance, with close to half of state grades found in the C-plus-to-C-minus range. The eight measures of equity and spending that appear in this section of the report represent some of the most commonly used indicators in school finance research. However, because our finance framework also echoes the field’s lack of certainty over how best to measure equity and adequacy, our indicators tap into multiple aspects of these two dimensions of school finance.
A given state may fare well on some measures of equity but poorly on others, since each indicator provides a somewhat different perspective on what it means for school funding to be “equitably” distributed within a state. The same can be said about the multiple aspects of financial expenditures. To take the equity results for the eighth-ranked state as an example, Wyoming makes a strong showing on the Wealth-Neutrality Index because spending levels are higher for districts found in less-wealthy areas. But it fares less well on the Coefficient of Variation and Restricted Range Index, which measure variations in district-to-district spending and gaps between the highest- and lowest-spending districts.