New national test data show that 4th and 8th graders have inched up in mathematics, but the results are more mixed in reading, with 4th grade scores flat compared with two years ago.
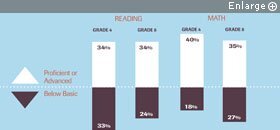
Overall, achieving proficiency in reading and math on the National Assessment of Educational Progress, known as “the nation’s report card,” remains an elusive goal for the majority of American students. Only about one-third reached that level or higher in reading and 8th grade math, the 2011 data show. At grade 4 math, meanwhile, the figure was slightly higher, at 40 percent.
David P. Driscoll, the chairman of the National Assessment Governing Board, which sets policy for NAEP, said in a statement that the nation has made major gains in math over the past two decades, but that in reading, the growth has been “quite small.” And he called the 4th grade reading scores “deeply disappointing,” noting that they have been flat since 2007.
“That rang an alarm bell with me,” Doris R. Hicks, also a member of NAGB and the principal of a charter school in New Orleans, said of the failure to see 4th grade reading improvements. “Even though it wasn’t a decline, I saw it as losing ground,” she said in a statement.
Since 1992, the average scale score in 4th grade reading has climbed just 4 points, to 221, on a 0-to-500 scale. At the 8th grade, the average score has risen 5 points.
Based on the latest results from the National Assessment of Educational Progress, a majority of American students still are not “proficient” in reading and math.
SOURCE: National Center for Educational Statistics
By contrast, in math, 4th grade scores have climbed 21 points over the same time period, and 16 points for 8th graders. From 2009 to 2011, the figures at both grade levels climbed 1 point, as well as 8th grade reading.
Mr. Driscoll, a former commissioner of education in Massachusetts, highlighted “an interesting flip” over time in reading and math, noting that while in the early years the proportion of students achieving proficiency in math trailed reading, the situation is now reversed.
At the same time, he expressed concern that math improvement is not keeping pace with earlier gains.
“Over the past eight years, progress has slowed, particularly at grade 4 where it had been very rapid for more than a decade,” he said. “The percentage of students ‘below basic’ has been reduced substantially, but it remains far too high—particularly at 8th grade for blacks and Hispanics.”
Stubborn Gaps
The reading and math NAEP is administered every two years. In math, it tests students in five content areas: number properties and operations; measurement; geometry; data analysis, statistics, and probability; and algebra. The reading assessment targets three cognitive areas: locate and recall information, integrate and interpret, and critique and evaluate.
One area of long-standing concern is the large achievement gaps among racial and ethnic groups, especially when comparing African-American and Hispanic students with white students. Although all groups have made academic progress over the past two decades, the achievement gaps have proved difficult to close.
Over the past two decades, growth in math achievement on NAEP has far eclipsed that in reading.
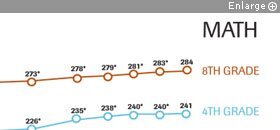
SOURCE: National Center for Education Statistics
The 2011 reading and math results produced no statistically significant changes in the black-white achievement gap from 2009. The gap, for example, in 8th grade math was 31 points. In fact, the 2011 gap was not deemed statistically different from 1990, the first year the national math test was administered. That said, the black-white gap has declined somewhat in other categories since 1990, including by 7 points for 4th grade math.
The gap between Hispanic and white students declined slightly between 2009 and 2011 in two categories. In 8th grade reading, the gap was reduced by 2 points, to 22. In 8th grade math, the gap was reduced by 3 points, to 23. But the 2011 figure was about the same as the gap recorded back in 1990.
To be sure, leaving aside achievement gaps, both Hispanic and black students have posted considerable academic gains over time, with especially strong strides in math.
In 1990, most black 4th graders, 83 percent, scored below basic in the subject. By 2011, that figure had plummeted to 34 percent. (The change since 2009 was not statistically significant.) Likewise, far fewer Hispanic 4th graders are performing below basic today, with the percentage declining from 67 percent in 1990 to 28 percent now.
The changes in 8th grade math for African-American and Hispanic students have also been large, though not quite as dramatic. For blacks, the below-basic figure has declined from 78 percent in 1990 to 49 percent today. For Hispanics, it has dropped from 66 percent to 39 percent. (Unlike with black 8th graders, the change between 2009 and 2011 was statistically significant for Hispanic students, dropping from 43 percent to 39 percent.)
State Ups and Downs
The new NAEP results also highlight changes in state by state performance. Hawaii was the only state to see improvements in both subjects at both grade levels. Meanwhile, Maryland’s reading scores improved at both the 4th and 8th grades. In addition, the District of Columbia, New Mexico, and Rhode Island saw improved math scores at both grade levels.
On the flip side, 4th grade math achievement declined in New York, and Missouri’s 8th graders fell in math. In reading, Missouri and South Dakota saw declines.
Mr. Driscoll said that over the past eight years, during which all states have been required to participate in the NAEP in reading and math, the largest overall gains occurred in Maryland, Massachusetts, and the District of Columbia, when looking at the increase in the percent reaching “proficient” in both subjects. And yet several other states “stood virtually still,” including Iowa, New York, and West Virginia.
Nevada registered statistically significant gains in both 8th grade reading and math compared with 2009, in both cases climbing 4 points. The state also saw 2-point gains in 4th grade reading and math, but neither was deemed statistically significant.
Keith W. Rheault, Nevada’s superintendent of public instruction, who was invited to comment on this year’s results at a press conference scheduled for this morning, said in prepared remarks that he was pleased to see the gains in his state, especially amid challenging economic times.
“As you may know, during the current recession, Nevada has become number one in the nation in some pretty dismal statistics,” including foreclosures, unemployment, and bankruptcy rates, he said. “All this has meant that property-tax collections are down, the state budget has been cut, the teaching force has been reduced, and spending on K-12 education has been cut by several hundred million dollars since 2008. However, in spite of all these problems, our state has continued to make gains on NAEP in both math and reading in most years.”
He added: “The improvements have been steady, not spectacular, but over the past eight years, they have added up to quite a bit.”


